
The Williams %R indicator is a key tool in technical analysis, offering valuable insights into market conditions. As traders navigate the complexities of the financial markets, understanding this indicator's nuances can provide a competitive edge.
By examining the Williams %R's calculation, interpretation, and practical applications, traders can enhance their decision-making process. This indicator's ability to gauge overbought and oversold levels effectively can potentially lead to strategic trading opportunities.
Let's uncover how this indicator influences trading strategies and market outcomes.
Definition of Williams %R
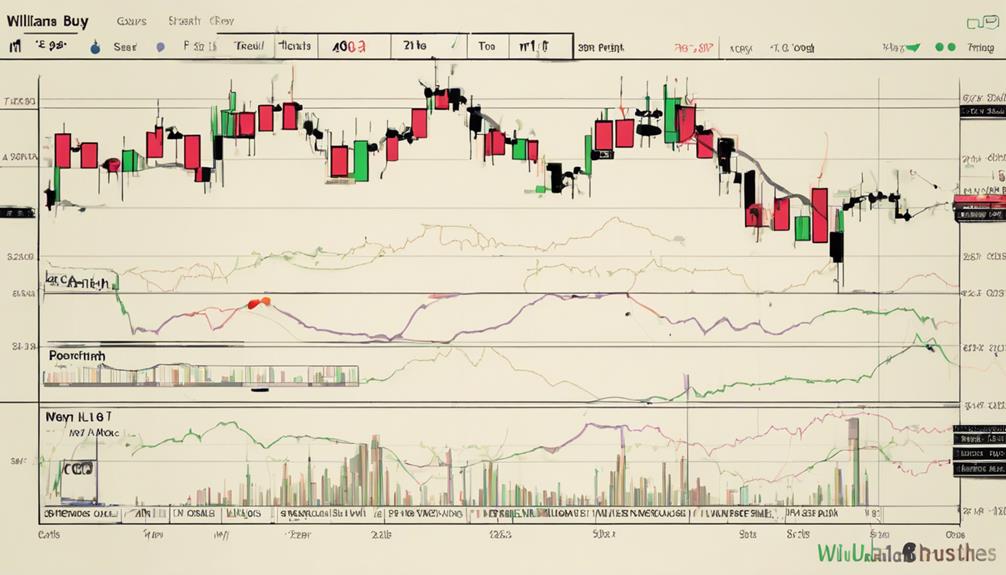
Williams %R, also known as the Williams Percent Range, is a technical indicator used in financial markets to evaluate the current position of a stock concerning its recent price range. This momentum indicator is valuable for determining overbought or oversold conditions on a scale from 0 to -100.
By comparing the closing price of a stock to its highest high over a specified period, Williams %R provides insights into the stock's price momentum. Readings above -20 suggest that a stock is overbought, potentially signaling a price reversal, while readings below -80 indicate oversold conditions, hinting at a possible price increase.
Traders and investors use Williams %R to identify potential trend changes based on price movements. When the indicator moves out of overbought or oversold territories, it can generate trading signals, assisting market participants in making informed decisions regarding buying or selling actions.
This technical tool adds a quantitative dimension to market analysis, helping traders navigate the complexities of financial markets with more confidence and precision.
Formula for Williams %R
One popular technical indicator used in financial markets to assess stock momentum based on recent price movements is the Williams %R. The Williams %R indicator formula is calculated as (Highest High – Close) / (Highest High – Lowest Low). This formula compares the closing price of a stock to its high-low range over a specific period, helping traders identify potential trend reversals or continuations based on price movements.
The indicator oscillates between 0 and -100, indicating overbought and oversold levels. Readings between -20 and 0 signify overbought conditions, suggesting a potential downward correction, while readings between -80 and -100 suggest oversold conditions, indicating a possible upward correction.
Interpreting Williams %R
An essential aspect of interpreting the Williams %R indicator involves understanding its implications for market conditions and potential price movements. The following points provide deeper insights into how to interpret this indicator effectively:
- Overbought Conditions: When Williams %R readings fall between -20 and 0, it suggests that the market is overbought. This indicates that the asset's price may be due for a potential reversal or correction as buying pressure has driven the price to relatively high levels.
- Oversold Conditions: Readings between -80 and -100 signal oversold conditions in the market. This implies that the asset's price has been pushed to exceptionally low levels due to selling pressure, potentially presenting a buying opportunity as the price could reverse its downward trend.
- Relative Price Levels: Williams %R compares the current closing price to the highest high over a specified period. Understanding these relative price levels helps traders gauge the momentum and strength of price movements, aiding in decision-making processes regarding potential trend reversals or continuations.
Advantages of Williams %R
The utility of the Williams %R indicator becomes apparent in its ability to swiftly pinpoint extreme market conditions, guiding traders towards strategic entry and exit points. By identifying overbought and oversold levels, typically above -20 and below -80, respectively, Williams %R equips traders with valuable insights into potential price reversals or continuations. This feature allows traders to make informed decisions based on the indicator's analysis of price movements relative to historical highs and lows.
Moreover, the precision offered by Williams %R in determining entry and exit points based on price movements within the high-low range enhances traders' ability to capitalize on market opportunities. Its versatility across different financial instruments and timeframes further solidifies its advantages, enabling traders to apply this tool across various trading scenarios. Additionally, traders can maximize the effectiveness of Williams %R by combining it with other indicators to refine their trading strategies and improve the accuracy of their trading signals.
Using Williams %R in Trading
Williams %R serves as a powerful tool for traders seeking to navigate and capitalize on market dynamics through its ability to identify overbought and oversold conditions effectively. When using Williams %R in trading, traders can benefit from the following:
- Identification of Oversold Territory: Williams %R helps traders pinpoint when an asset is oversold, indicating a potential buying opportunity as the price may reverse upwards.
- Analysis of Price Action: By analyzing price action in conjunction with Williams %R, traders can make more informed decisions on entry and exit points, enhancing the precision of their trades.
- Confirmation of Reversal Signals: Traders can use Williams %R to confirm potential trend reversals when the indicator moves out of overbought or oversold levels, adding confidence to their trading strategies.
Integrating Williams %R into trading approaches can provide valuable insights into market conditions, offering a systematic way to interpret price movements and make strategic trading decisions.
Can You Explain the Williams %R Indicator in More Detail?
The Williams %R indicator in analysis is a momentum oscillator that measures overbought or oversold levels in a stock or other asset. Developed by Larry Williams, it helps identify potential reversals and can be used to confirm trend strength. Traders often use it to make buy or sell decisions.
Frequently Asked Questions
What Is the Difference Between RSI and Williams R Indicator?
RSI and Williams %R differ in their focus; RSI measures price momentum, while Williams %R identifies overbought/oversold levels. RSI ranges 0-100, offering trend confirmation, whereas Williams %R moves from 0 to -100, highlighting extreme conditions and potential reversals promptly.
Is Williams %R Leading or Lagging?
Williams %R is a leading indicator, offering proactive insights into market conditions by identifying potential trend reversals before price movements occur. By signaling overbought and oversold levels, it guides traders in making informed decisions based on momentum shifts.
What Is the Best Setting for Williams %R?
The best setting for Williams %R depends on traders' risk tolerance, time horizon, and market conditions. A 14-day period is common, but adjusting it to shorter (e.g., 10 days) or longer (e.g., 20 days) periods can tailor sensitivity to price changes and signal accuracy.
What Is the Difference Between Williams R and Stochastic?
Diving into technical analysis, the distinction between Williams %R and Stochastic lies in their reference points for price comparisons: Williams %R compares closing prices to the highest high, while Stochastic contrasts them against the lowest low.
Conclusion
In conclusion, the Williams %R indicator is a valuable tool for traders to assess overbought and oversold conditions in the market.
By utilizing this momentum indicator, traders can identify potential entry and exit points, as well as potential trend reversals or continuations.
Its formula and interpretation offer insights into market conditions, providing a useful guide for making informed trading decisions.
Overall, the Williams %R indicator serves as a key component in technical analysis for traders.