
Exploring the realm of equity trading through the lens of Gann Theory Techniques unveils a structured approach to deciphering market dynamics and enhancing trading strategies.
From harnessing Gann Angles to decoding Price-Time Relationships, each technique offers a unique perspective on market behavior.
Understanding these techniques not only equips traders with a deeper comprehension of market trends but also empowers them to navigate the intricate web of equity trading with precision and foresight.
Mastering these techniques could be the differentiating factor between a novice trader and a seasoned professional in the dynamic world of equity markets.
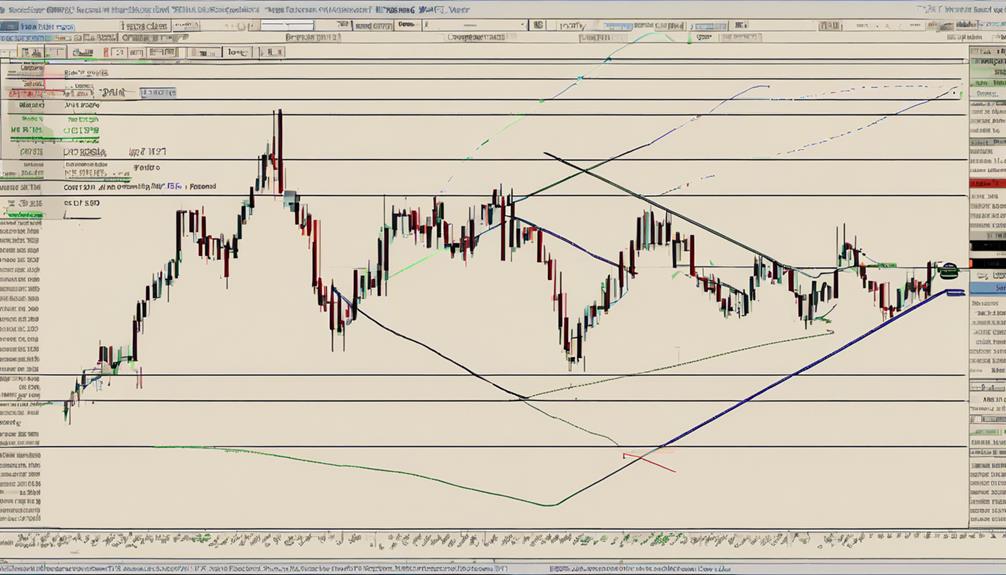
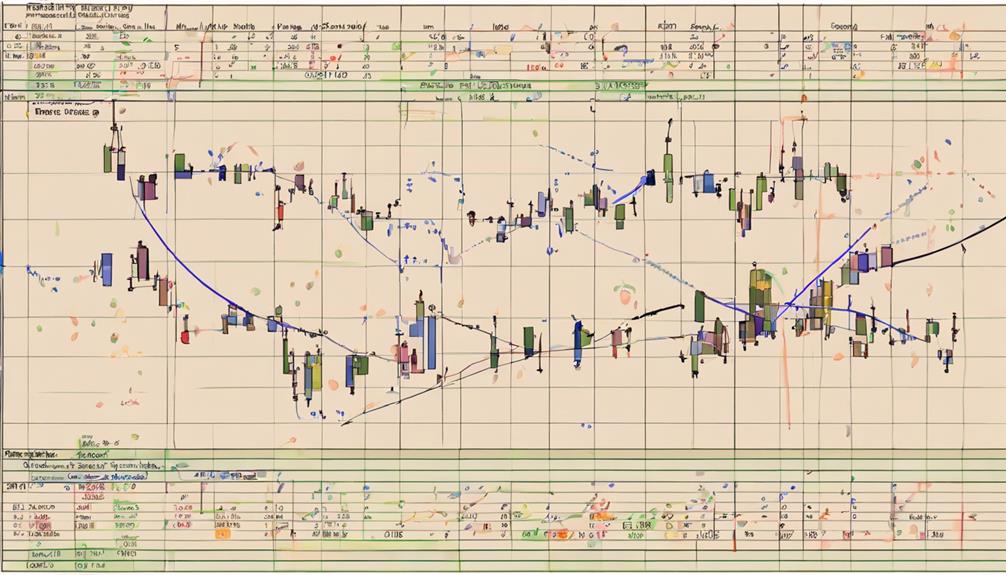
Gann Angles Analysis
Utilizing Gann angles in equity trading analysis is fundamental for predicting market trends and identifying critical support and resistance levels. Gann angles, a key element of Gann Theory, are based on geometric principles and play a crucial role in price chart analysis. These angles provide a visual representation of the relationship between price and time, aiding traders in making informed decisions.
One of the primary uses of Gann angles is to identify support and resistance levels in the market. Traders can observe how prices interact with these angles to determine potential entry and exit points. The 1×1 Gann angle, representing a 45-degree angle on the price chart, is particularly significant as it helps in determining the strength and direction of a trend. Different Gann angles indicate bullish or bearish market conditions, assisting traders in developing effective trading strategies based on market sentiment and price movements. Overall, incorporating Gann angles into trading analysis can enhance decision-making processes and improve overall trading outcomes.
Fibonacci Retracement Application
Fibonacci retracement levels, such as 38.2%, 50%, and 61.8%, play a crucial role in Gann Theory for equity trading. These levels offer insights into potential areas of price reversal after a significant market move.
Fibonacci Levels Explanation
Derived from the famous Fibonacci sequence, these levels serve as crucial indicators within Gann Theory for pinpointing potential price retracement zones in equity trading strategies.
Fibonacci retracement levels, such as 23.6%, 38.2%, 50%, 61.8%, and 76.4%, are used to identify key levels of support and resistance. Traders apply the Fibonacci retracement tool from a significant low to a significant high to anticipate potential pullback levels where price corrections may halt and the trend could continue.
Understanding Fibonacci levels in Gann Theory enables traders to determine optimal entry and exit points in equity trading. By incorporating these price retracement levels, traders gain insights into potential areas where the market might reverse, allowing for informed decision-making in their trading strategies.
Practical Trading Tips
Drawing on the foundational principles of Gann Theory, practical trading tips implementing Fibonacci retracement levels can significantly enhance equity trading strategies. By applying Fibonacci levels to financial charts, traders can identify key support and resistance levels that align with Gann angles, aiding in predicting potential price movements.
Utilizing Fibonacci retracement within a specific time frame can provide valuable insights into possible reversal points and continuation patterns, guiding traders in making well-informed decisions. The strategic placement of Fibonacci levels at 23.6%, 38.2%, 50%, 61.8%, and 100% can assist in determining entry and exit points, effectively managing risk in equity trading.
Understanding how to interpret Fibonacci retracement levels within the context of Gann Theory can empower traders to navigate market fluctuations with precision.
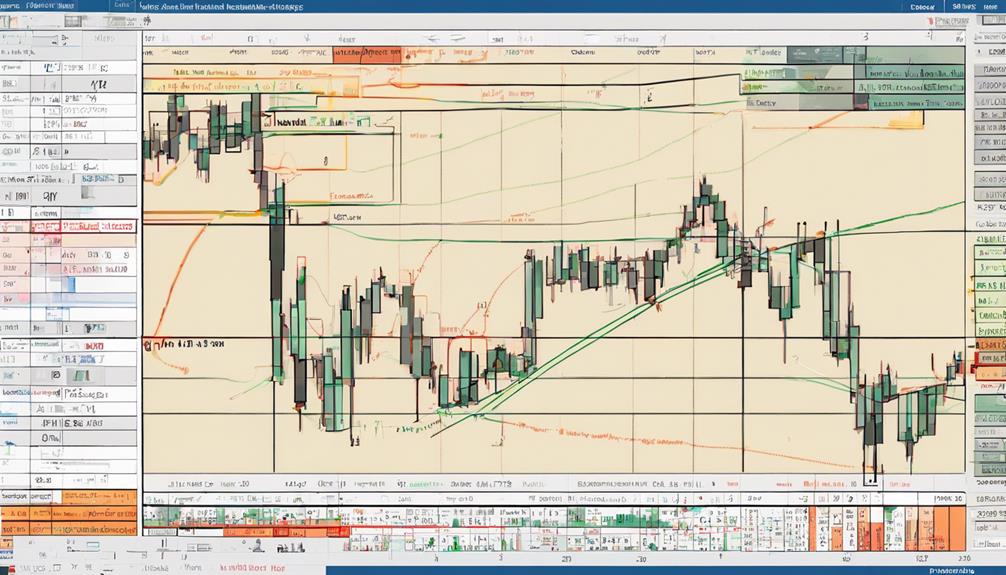
Time and Price Squaring
Time and price squaring in Gann Theory involves the application of geometric time-price analysis and the Square of 9 concept to identify critical market levels.
By understanding the relationship between time and price squares, traders can anticipate potential trend changes and reversals with greater precision.
This technique provides valuable insights into market dynamics and enhances decision-making processes in equity trading.
Geometric Time-Price Analysis
Utilizing geometric principles in time-price analysis within Gann Theory offers traders a methodical approach to pinpointing critical market reversal points and trend shifts.
- Geometric time-price analysis involves aligning time and price to identify key reversal points and trend changes.
- Traders use this technique to forecast support and resistance levels based on historical price movements.
- Applying Gann Theory techniques like time and price squaring enhances decision-making processes in equity trading.
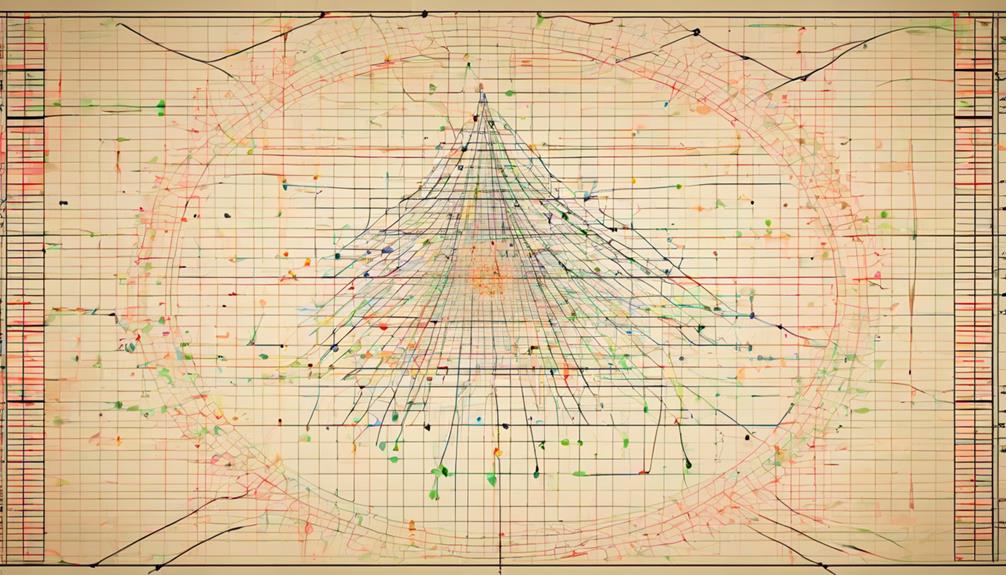
Square of 9 Concept
Aligning with the principles of Gann Theory, the Square of 9 concept integrates time and price squaring techniques to identify crucial support and resistance levels in market analysis. This technique employs geometric calculations within a square grid structure to pinpoint specific price and time levels.
Traders utilize the Square of 9 concept to forecast potential reversal points and determine price targets in the market. By applying this method, traders can gain insights into significant turning points in stock prices. The Square of 9 concept plays a vital role in technical analysis by providing a systematic approach to understanding market movements and establishing key levels that can influence trading decisions.
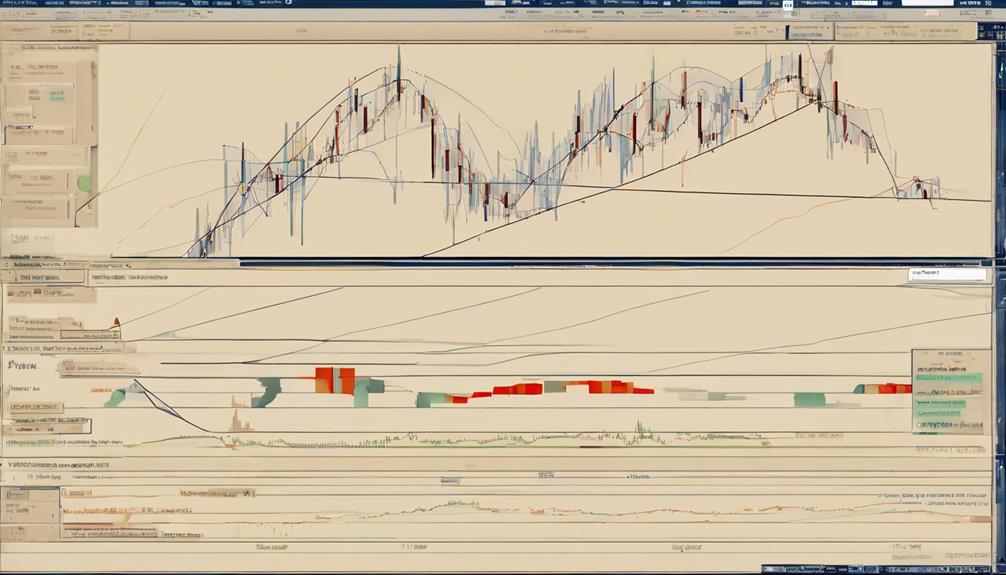
Gann Swing Charts Strategy
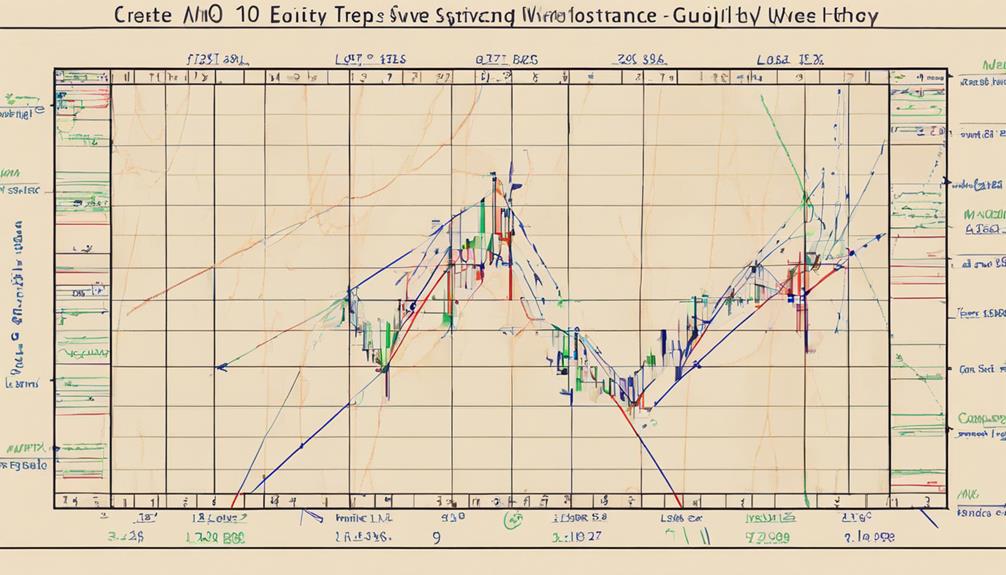
Gann Swing Charts Strategy is a powerful tool used by traders to accurately identify market swings and trends. Traders rely on Gann indicators to plot Swing Charts, marking Swing highs and Swing lows to assess price action effectively. These charts help determine the trend angle, aiding traders in understanding the market's direction and potential reversals.
By analyzing the sequence of higher highs and higher lows, traders can make informed decisions about entry and exit points for their trades. Utilizing Gann Swing Charts, traders visualize market volatility, enabling them to react promptly to changing market conditions.
This strategy, rooted in Gann theory, provides a structured approach to interpreting market movements, aiding traders in navigating the complexities of equity trading.
Gann Grid Utilization
The application of the Gann Grid charting tool offers traders a systematic method to analyze price movements and trends within the market. The Gann Grid consists of horizontal and vertical lines that form a grid, aiding in the identification of key support and resistance levels.
Traders utilize this tool to forecast potential price movements and make informed trading decisions based on these levels. By visually representing price patterns, the Gann Grid assists in recognizing significant turning points in the market.
Through the application of Gann Grid techniques, traders can enhance their understanding of market dynamics, enabling them to develop more effective trading strategies. This tool helps traders in establishing a structured approach to market analysis, leading to more informed decisions and potentially improved trading outcomes.
Square of Nine Technique

The POINTS associated with the Square of Nine technique encompass:
- The calculation of angles,
- Application in forecasting, and
- Analysis of price and time relationships.
Traders utilize these elements to determine potential price levels and anticipate market movements. Understanding these aspects of the Square of Nine technique aids traders in making informed decisions and managing risk effectively.
Calculation of Angles
Utilizing the Square of Nine technique in Gann Theory involves calculating angles through a square root sequence, allowing traders to identify key price levels and potential reversal points in the market.
Angles are derived by moving in a spiral pattern around the central number.
Each angle represents a specific price movement or level.
Traders can use these angles along with technical analysis tools like trend lines to set stop-loss levels and predict future price movements more accurately.
Application in Forecasting
Application of the Square of Nine Technique in forecasting involves leveraging geometric angles and numerical relationships to predict potential support and resistance levels in the market.
This Gann Theory tool utilizes a grid structure where each number signifies a specific price or time point. By analyzing the intersections and patterns within this grid, traders can anticipate key levels where the market may encounter support or resistance.
The Square of Nine technique aids in identifying critical price points and time targets that could signal upcoming trend changes. When integrated with other Gann Theory techniques, it becomes a powerful asset in equity trading, providing traders with valuable insights for making informed decisions based on historical price movements and mathematical relationships.
Price and Time Relationships
Incorporating the Square of Nine technique into equity trading strategies allows traders to leverage geometric principles and numerical relationships to forecast key price and time relationships in the market. This technique, rooted in Gann Theory, provides a systematic approach to analyzing price levels, support and resistance, and predicting market movements based on geometric patterns.
Traders can utilize the Square of Nine to identify significant support and resistance levels, aiding in making informed trading decisions. Moreover, this method enables the determination of potential price targets and reversals, enhancing the precision of trading strategies. By incorporating the Square of Nine technique, traders can gain a deeper understanding of market dynamics and improve their ability to anticipate price movements effectively.
- Utilizes geometric principles for price level analysis
- Identifies key support and resistance levels
- Helps in forecasting price targets
Price-Time Relationships
The significance of price-time relationships in Gann Theory lies in their ability to forecast market movements with precision and accuracy. Gann Theory emphasizes the delicate balance between price and time, suggesting that analyzing the synchronization of these two factors can help identify crucial market turning points.
By focusing on specific time intervals and correlating them with corresponding price levels, traders can gain insights into potential market trends and reversals. The relationship between price and time forms the foundation of various Gann Theory techniques, providing traders with a structured approach to understanding market dynamics.
Through the lens of price-time relationships, traders can develop a deeper understanding of market behavior and make more informed trading decisions. This analytical framework allows traders to anticipate market movements based on the intricate interplay between price levels and the passage of time, offering a methodical way to navigate the complexities of equity trading.
Gann Fan Implementation
Utilizing Gann Fan angles in equity trading involves applying geometric principles and market cycles to forecast future price movements. By understanding how Gann Fan angles work, traders can identify crucial support and resistance levels for making informed trading decisions.
Here are three key points to consider when implementing Gann Fan angles in trading strategies:
- Accurate Angle Placement: Drawing Gann Fan angles requires selecting major swing highs or lows to ensure precise angle placement, enhancing the effectiveness of this technical analysis tool.
- Market Balance Prediction: The Gann Fan indicator helps traders synchronize price and time intervals, aiding in predicting market balance and potential price movements.
- Entry Points and Trend Reversals: Gann Fan angles play a vital role in determining entry points and confirming trend reversals, assisting traders in executing well-timed trades based on market dynamics.
Market Trend Forecasting
Forecasting market trends in equity trading requires a systematic analysis of historical data and the application of predictive techniques to anticipate future price movements.
Gann Theory techniques, such as Gann Angles, play a crucial role in this process by providing support and resistance levels that aid in predicting equity market movements.
These techniques, rooted in the principles of W.D. Gann, have shown an impressive accuracy rate of up to 90% in forecasting market trends.
Gann Theory Risk Management
To navigate the complexities of equity trading with Gann Theory, a meticulous approach to risk management is paramount, underscoring the critical role it plays in optimizing trading outcomes. Implementing Gann Theory risk management techniques can help traders protect their capital and maximize profits.
Here are three key strategies for effective risk management in Gann Theory:
- Protective Stop Loss Orders: Setting stop loss orders below recent swing lows is essential in Gann Theory to limit potential losses and manage risk exposure effectively.
- Take Profit Levels: Determining both stop loss and take profit levels after entering a trade is a fundamental risk management practice that ensures traders secure profits at strategic points.
- Buffer of 20 Pips****: Adding a buffer of 20 pips to stop loss and take profit levels can help traders avoid premature exits due to market volatility, providing a safeguard against false breakouts.
How Can Gann Theory Techniques Improve Equity Trading Strategies?
Gann Theory in technical analysis offers unique tools for equity trading strategies. By using Gann’s techniques, traders can gain insights into potential price movements, trend analysis, and market cycles. Incorporating Gann Theory into technical analysis can enhance decision-making and optimize trading performance for better results in the equity market.
Frequently Asked Questions
What Is the 9 5 Gann Rule?
The 9-5 Gann rule is a market principle indicating that if prices rise for 9 consecutive days, a potential correction lasting 5 days may follow. Traders leverage this rule to anticipate market shifts and strategically time their trades for optimal outcomes.
How Accurate Is Gann Theory?
Gann Theory's accuracy hinges on meticulous analysis of geometric patterns and time cycles. While historical data indicates up to 90% precision in forecasting price movements, successful implementation requires a deep understanding and application of its principles.
What Is the Most Important Gann Angle?
The most critical Gann angle is the 1×1 angle, denoting a 45-degree slope on price charts. It symbolizes equilibrium between time and price movements, aiding in identifying significant support and resistance levels. Traders rely on the 1×1 angle for trend analysis and precise decision-making.
What Is the 369 Theory in Trading?
The 369 theory in trading involves identifying cycles of 3-6-9 days to anticipate market reversals. Traders leverage this concept to pinpoint potential turning points by aligning with Gann's principles of geometric patterns and time cycles, aiding in strategic decision-making.
Conclusion
In conclusion, mastering the Top 10 Gann Theory techniques for equity trading can significantly enhance traders' ability to analyze market movements, predict trends, and make informed decisions.
By utilizing strategies such as Gann Angles Analysis, Fibonacci Retracement Application, and Gann Fan Implementation, traders can effectively manage risks and capitalize on market opportunities.
Understanding key levels for buying and selling, as well as predicting market corrections, are essential components of successful equity trading.