
As you dip your toes into the vast ocean of technical analysis, exploring the intricate world of moving averages can be akin to navigating through shifting tides. With each wave of data, these indicators offer a glimpse into the underlying currents of market trends.
Understanding the nuances of how moving averages interact with price action and other technical tools can provide you with a solid foundation for making informed trading decisions. So, as you delve deeper into the realm of moving averages, be prepared to uncover key insights that could potentially elevate your trading strategies to new heights.
Types of Moving Averages
When considering types of moving averages, you may find that each variant offers unique advantages in analyzing market trends and price movements effectively.
The Simple Moving Average (SMA) calculates the average price over a specific period, smoothing out price fluctuations to identify trends and support/resistance levels.
On the other hand, the Exponential Moving Average (EMA) places more weight on recent prices, making it more responsive to current market trends.
Additionally, the Weighted Moving Average (WMA) assigns decreasing weights to recent data points, emphasizing the most recent prices in the analysis.
These technical analysis tools are crucial for making informed trading decisions based on accurate predictions of future price movements.
Trend Identification Using Moving Averages
When using moving averages for trend identification, it's crucial to understand the significance of the Simple Moving Average (SMA), Exponential Moving Average (EMA), and the Golden Cross Signal.
These indicators play a key role in determining potential shifts in market trends. By analyzing these moving averages, traders can gain valuable insights into the direction of stock prices and make informed decisions based on trend signals.
Simple Moving Average
Calculating the Simple Moving Average (SMA) involves determining the average closing prices over a specific period, offering a straightforward method for identifying trends in the market. As a technical indicator, traders use moving averages like SMA to analyze price trends effectively.
The SMA smooths out price data, making it easier to identify the direction of the overall trend. Traders often rely on the SMA to pinpoint potential support and resistance levels within the market.
Exponential Moving Average
To effectively identify market trends using moving averages, you should consider the Exponential Moving Average (EMA) for its responsiveness to recent price data. The EMA places more weight on the most recent prices, making it a popular choice for traders seeking timely signals on trend changes and confirmation of trend strength.
Unlike the Simple Moving Average (SMA), the EMA reacts more swiftly to price fluctuations, providing a dynamic view of market movements. By using the EMA, traders can make informed decisions based on the current market conditions, enhancing their ability to identify trends accurately. This makes the EMA a valuable tool for those looking to engage in trend identification and stay ahead of market shifts.
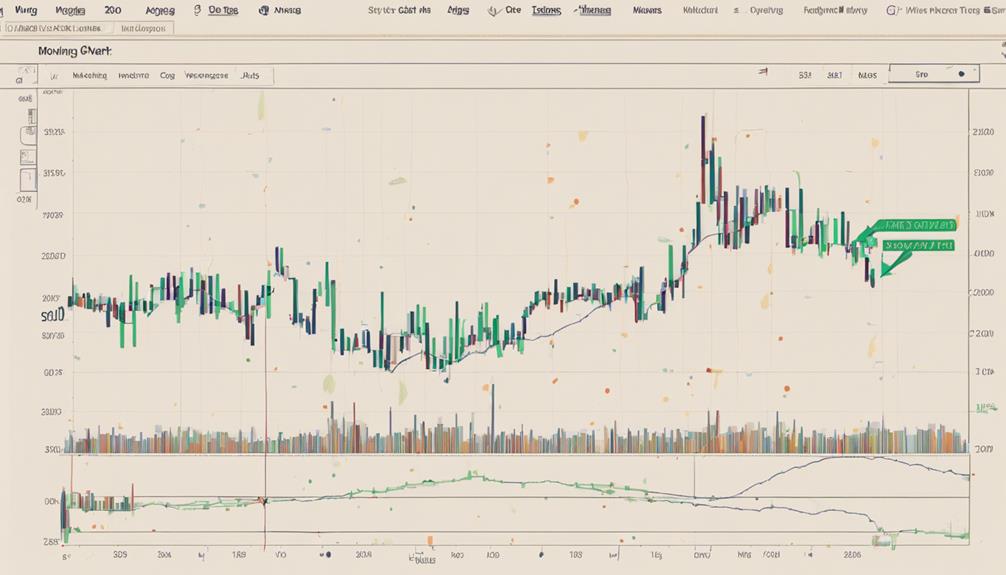
Golden Cross Signal
Considering the Exponential Moving Average's responsiveness to recent price data, transitioning to the Golden Cross signal for trend identification offers traders a valuable tool in spotting potential market shifts.
The Golden Cross signal occurs when a short-term moving average crosses above a long-term moving average, indicating a potential uptrend.
It's a bullish signal used by traders to identify trend reversals and potential buying opportunities.
Commonly observed with the 50-day and 200-day moving averages, the Golden Cross suggests a shift from a bearish to a bullish market sentiment.
Traders often look for confirmation from other technical indicators or price action when interpreting the Golden Cross signal.
Support and Resistance Levels Analysis
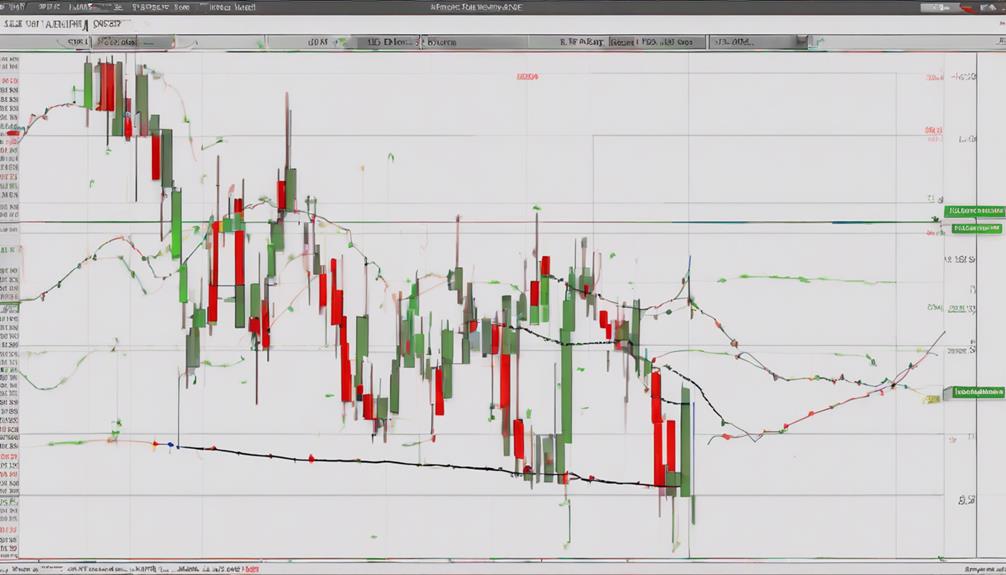
Support and resistance levels are crucial elements in technical analysis that help traders anticipate potential price movements. Moving averages play a significant role in identifying these levels. When prices are above the moving average, it indicates an uptrend and helps in recognizing support levels. On the other hand, prices below the moving average signal a downtrend and highlight resistance levels. Moving averages smooth out price fluctuations, confirming potential support and resistance levels.
Support levels act as a floor for prices, preventing them from dropping further, while resistance levels act as a ceiling, restricting upward movement. Understanding and utilizing these levels can assist traders in making informed decisions and navigating market trends effectively.
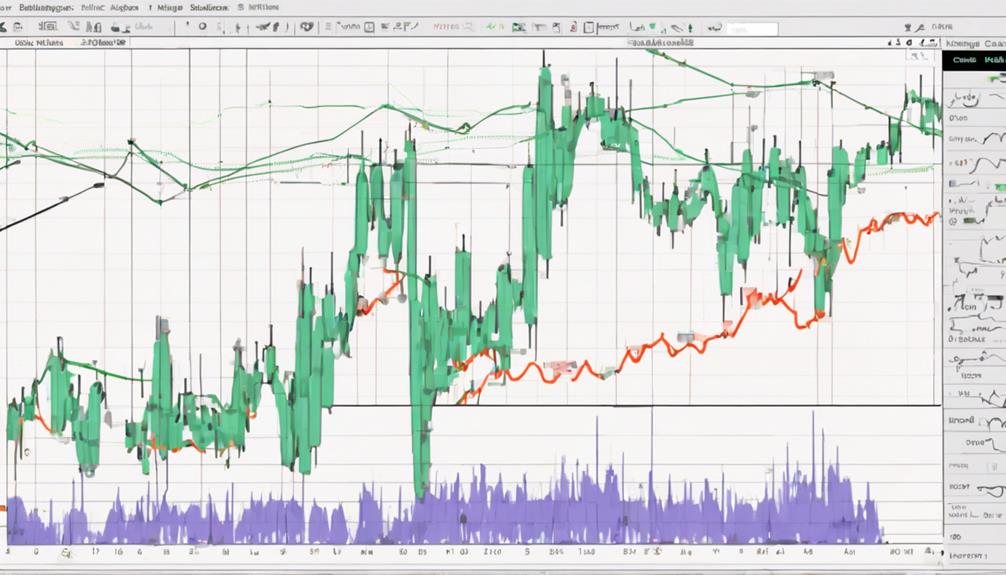
Dynamic Nature of Moving Averages
Adapting to changing price data over time, moving averages provide a smoothed representation of price trends by constantly updating based on the latest data points.
- The dynamic nature of moving averages helps in identifying trend changes promptly.
- Moving averages adjust values with new price data, reflecting the most recent market conditions.
- Traders rely on this dynamic nature to capture evolving trends.
- By staying current with market movements, moving averages assist in making informed trading decisions.
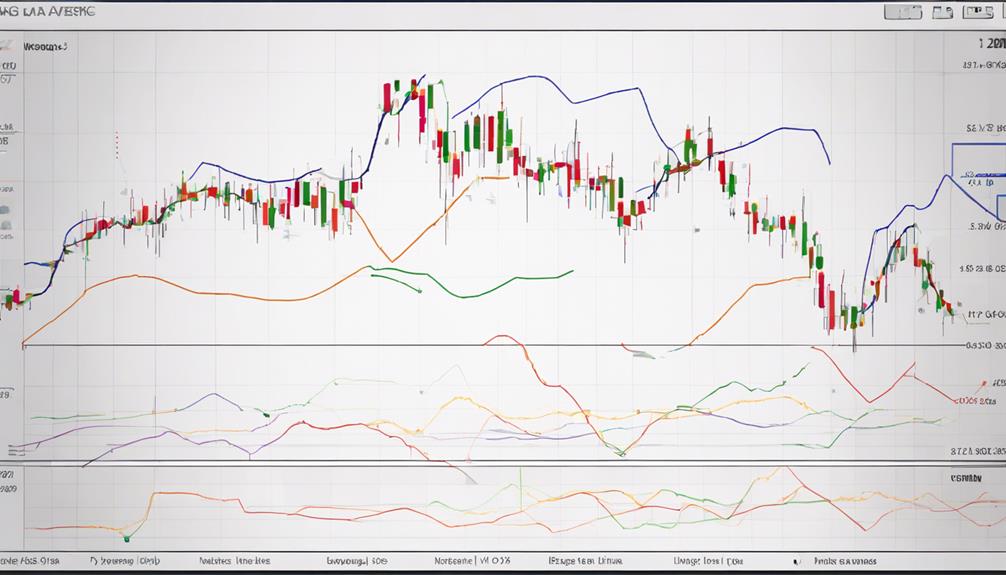
Integration With Other Indicators
When integrating moving averages with other indicators, you can strategize by combining signals effectively to confirm trend direction and momentum.
Understanding indicator synergy strategies is crucial for interpreting conflicting indications that may arise.
Indicator Synergy Strategies
Integrating moving averages with other technical indicators can significantly enhance your trading decisions by providing corroborative signals and a more comprehensive analysis of market trends.
When combining moving averages with oscillators like RSI or MACD, you can confirm trend signals effectively. Additionally, integrating moving averages with volume indicators such as OBV or A/D line offers insights into market strength.
Using multiple indicators in synergy with moving averages can help improve trade entry and exit decisions. By employing synergistic strategies involving moving averages and trend/momentum indicators, traders can make more well-rounded decisions.
This integration of various technical indicators with moving averages ultimately enhances the accuracy of market analysis and trading signals.
Combining Signals Effectively
To effectively combine signals from moving averages with other technical indicators, consider utilizing a synergy approach to enhance your trading decisions. Integrating signals from indicators like RSI or MACD can provide confirmation of trend direction and strength, enhancing the reliability of your trading strategies.
By incorporating multiple indicators with moving averages, you can gain a comprehensive view of market conditions and identify potential trading opportunities more effectively. This integration allows you to validate signals, leading to more robust trading setups and improved risk management.
When combining signals effectively, traders can reduce the risk of false signals and make more informed decisions based on a holistic analysis of various indicators.
Interpreting Conflicting Indications
Consider the incorporation of multiple technical indicators alongside moving averages when faced with conflicting signals to validate trade setups effectively and enhance decision-making in the market.
- Combining moving averages with oscillators like the Relative Strength Index (RSI) or the Stochastic Oscillator can provide additional insights and reduce false signals.
- Looking for alignment between moving averages, trend indicators, and volume indicators can help traders make more accurate decisions in the market.
- Integration of various technical indicators with moving averages can enhance the robustness of trading strategies and improve overall performance.
- Analyzing divergences and convergences between different indicators alongside moving averages allows traders to gain a comprehensive understanding of market conditions and potential trade opportunities.
Common Mistakes When Using Averages

When using moving averages, one common mistake is incorrectly choosing the length of the moving average window, which can lead to inaccurate trend analysis. Neglecting outliers in the data when calculating moving averages can skew the analysis results.
Failing to adjust the moving average parameters for different market conditions may result in ineffective trading signals. It's crucial to consider the smoothing effect that moving averages have on price data to avoid misinterpreting trends.
Additionally, not combining moving averages with other technical indicators could limit the effectiveness of your trading strategies. By being mindful of these common mistakes in technical analysis, you can enhance the accuracy of your market assessments and improve your decision-making process.
How Can Moving Averages Provide Key Insights Into Technical Indicators?
Moving averages in analysis can provide valuable insights into technical indicators by smoothing out price fluctuations and indicating the direction of a trend. They can help identify support and resistance levels, signal potential trend reversals, and provide clarity on market movements, making them a crucial tool for traders and analysts.
Key Takeaways for Trading Success
Enhancing trading success involves leveraging key takeaways from combining moving averages with various technical indicators for accurate trend analysis and signal confirmation. When looking to boost your trading performance, consider the following essential points:
- Moving Averages: Use different types like SMA, EMA, and WMA for precise trend identification.
- Technical Indicators: Incorporate RSI and MACD to enhance trend confirmation.
- Bullish/Bearish Crossovers: Monitor these crossovers in moving averages for potential market direction changes.
- Support/Resistance Levels: Moving averages help in identifying these critical levels for strategic entry and exit points.
What Are Some Key Insights Into Using Moving Averages for Forex Trading?
When it comes to using moving averages in forex trading, it’s important to consider the different types, such as simple and exponential moving averages. These can provide key insights into market trends and potential entry or exit points for traders. Understanding how to effectively use moving averages can significantly improve trading strategies.
Frequently Asked Questions
What Does the Moving Average Indicate in Technical Analysis?
In technical analysis, the moving average indicates trend direction and strength by smoothing price fluctuations. It helps identify potential support and resistance levels. Different time frames offer insights into market trends. Use it with indicators for confirmation.
What Is a Key Assumption of Technical Analysis?
In technical analysis, a key assumption is that historical price movements tend to repeat themselves. By identifying market trends and patterns, traders aim to forecast future price movements. This belief guides decision-making based on past data.
How Are Technical Indicators Different From Moving Averages?
Technical indicators offer real-time signals based on market conditions, while moving averages smooth out trends based on past prices. They provide insights into market momentum and overbought/oversold conditions, complementing each other for comprehensive analysis.
Which Indicator Works Best With Moving Average?
When combining technical indicators with moving averages, the Relative Strength Index (RSI) stands out for spotting overbought and oversold conditions effectively. It complements moving averages to provide insights for potential market shifts.
Conclusion
In conclusion, mastering moving averages and technical indicators is crucial for successful trading. By understanding the different types of moving averages, identifying trends, analyzing support and resistance levels, and integrating with other indicators, you can make informed decisions in the stock market.
Avoid common mistakes and remember the dynamic nature of moving averages to improve your trading strategy. Keep these key insights in mind for trading success.