
If you've ever heard the saying 'the trend is your friend,' then understanding the Ichimoku Cloud indicator is crucial for your trading arsenal.
Imagine having a tool that not only provides you with support and resistance levels but also gives you a comprehensive view of market trends and momentum.
The simplicity of this guide will help you navigate the complexities of this powerful indicator seamlessly, allowing you to make informed trading decisions with confidence.
Key Takeaways
Key takeaways from understanding the Ichimoku Cloud indicator include its ability to provide comprehensive insights into support and resistance levels, momentum, and trend direction within a single chart.
When analyzing price action, the indicator's Conversion Line and Base Line identify potential support and resistance levels. These levels are crucial for traders to make informed decisions on entry and exit points.
Moreover, the Leading Span A and Leading Span B components offer a unique perspective on trend direction and momentum. By observing the interaction between these spans and the Cloud, traders can gauge the strength of a trend and potential trend reversals.
Mastering the interpretation of these components is vital for utilizing the Ichimoku Cloud effectively in technical analysis.
Formulas for Ichimoku Cloud
The formulas used to calculate the Ichimoku Cloud indicator's components play a crucial role in generating data points for analyzing trend direction, momentum, and support/resistance levels. To understand how each component is derived, consider the following:
- Conversion Line: Calculated as the average of the 9-period high and low prices.
- Base Line: Derived as the average of the 26-period high and low prices.
- Leading Span A: Computed as the average of the Conversion Line and Base Line.
These formulas are fundamental in creating the lines and cloud of the Ichimoku indicator, offering insights into potential market trends and key levels of support and resistance. Understanding how these values are calculated is essential for interpreting the indicator's signals accurately.
Understanding Ichimoku Cloud Signals
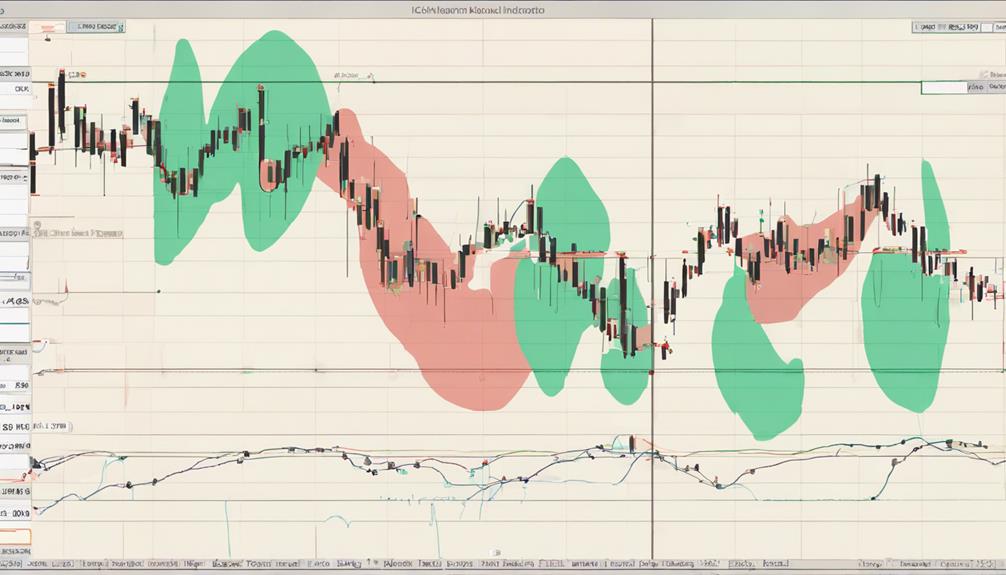
To grasp the implications of Ichimoku Cloud signals effectively, understanding how price positioning relative to the Cloud influences market sentiment is essential.
When the price is above the Cloud, it indicates bullish momentum, while being below suggests bearish sentiment.
The crossing of the Conversion and Base lines within the Cloud can signal potential trend changes.
Moreover, the Cloud serves as dynamic support during uptrends and resistance in downtrends, offering valuable insights into market direction.
By analyzing the Cloud's leading and lagging spans, traders can project future support and resistance levels, aiding in decision-making processes.
Differences From Moving Averages
When comparing the Ichimoku Cloud indicator to moving averages, you'll notice a distinct methodology in how averages are calculated. Here are some key differences:
- Span Calculation: The Ichimoku Cloud uses a unique formula that considers the midpoint of the highs and lows over a specified period to calculate its spans, unlike moving averages that solely rely on closing prices.
- Line Interpretation: The Ichimoku Cloud incorporates a baseline called the Leading Span B, which helps in identifying potential support and resistance levels, while moving averages focus on the average closing prices over a specific period.
- Predictive Capabilities: Unlike moving averages that reflect historical data, the Ichimoku Cloud provides future projections through its various components, offering traders a more forward-looking perspective on market trends.
Limitations and Best Practices
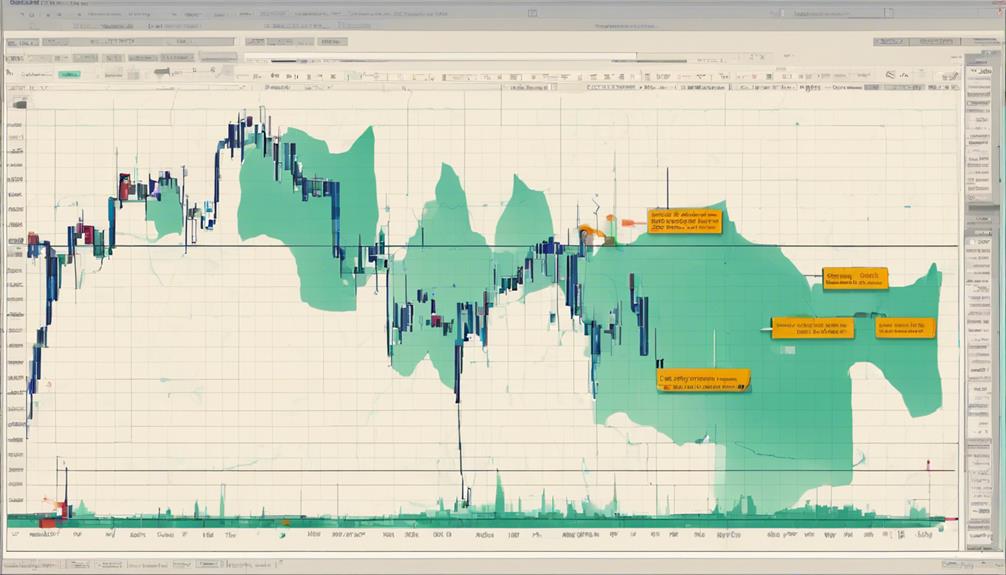
Considering the potential limitations and best practices associated with the Ichimoku Cloud indicator can significantly enhance your trading strategies and decision-making process. Ichimoku Cloud may struggle in choppy markets due to its trend-following nature.
To interpret it effectively, a solid grasp of all five components is necessary, although subjective interpretations can vary. Validating Ichimoku Cloud signals with other technical tools is crucial for confirmation.
Incorporating other market factors alongside this indicator is essential for comprehensive analysis and decision-making. When using Ichimoku Cloud, be cautious of its performance in sideways markets, ensure a thorough understanding of its components for accurate interpretation, and always confirm its signals with other indicators to avoid potential pitfalls and false signals, especially at resistance levels.
Can you explain the Ichimoku Cloud indicator in a simple and easy-to-understand way?
The simplified Ichimoku Cloud indicator is a popular technical analysis tool used to identify potential trend direction, support, and resistance levels. It consists of five lines that work together to produce buy or sell signals. Essentially, it provides a visual representation of support and resistance levels and can help traders make informed trading decisions.
Frequently Asked Questions
What Is the Best Indicator for Ichimoku Cloud?
When trading with Ichimoku Cloud, focus on the Tenkan-sen and Kijun-sen lines as key indicators. These lines provide dynamic support and resistance levels, with a bullish signal when the Tenkan-sen crosses above the Kijun-sen.
What Is the Basic Ichimoku Strategy?
To grasp the basic Ichimoku strategy, focus on the Conversion and Base lines for support and resistance. Buy trades are ideal when above both lines, signaling bullish momentum. Crosses of these lines affirm market direction.
How Do You Use Ichimoku Indicator?
To use the Ichimoku indicator effectively, analyze trend direction with price above the Cloud signaling uptrend and below indicating downtrend. Utilize the Conversion Line and Base Line for support/resistance. Combine with indicators like RSI for enhanced accuracy.
What Is the Formula for the Ichimoku Cloud?
To understand the Ichimoku Cloud, think of it as a weather forecast for the markets. It combines various elements like the Conversion Line and Leading Span A/B to predict potential price movements accurately.
Conclusion
In conclusion, mastering the Ichimoku Cloud indicator is like having a powerful compass to navigate the complex waters of the financial markets. By understanding its formulas, signals, and differences from moving averages, traders can gain valuable insights into potential market trends and make informed decisions.
While it has its limitations, incorporating best practices can enhance its effectiveness as a tool for technical analysis. Embrace the Ichimoku Cloud as your guiding star in the world of trading.