
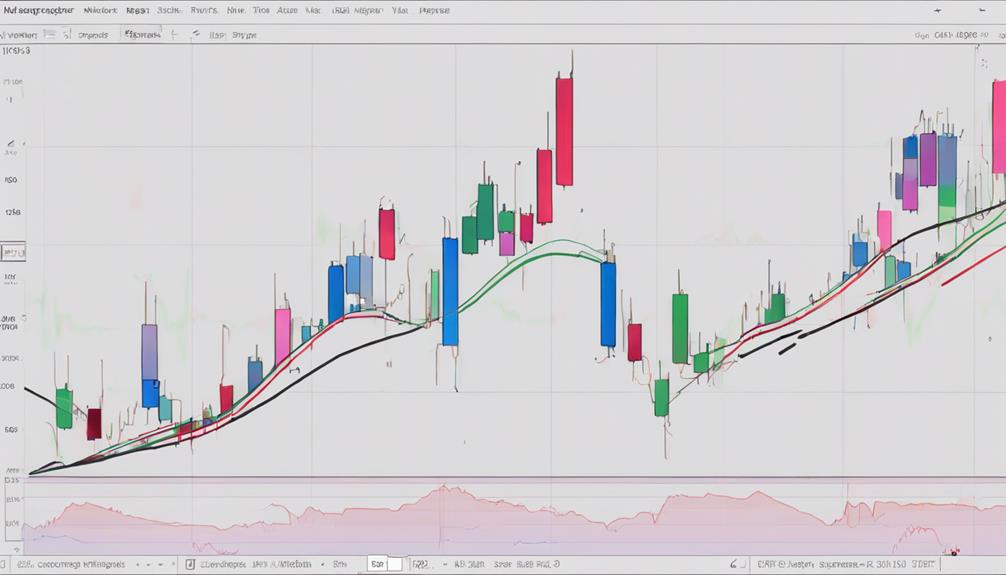
When assessing market trends, imagine utilizing the Simple Moving Average (SMA) to gauge trend direction and strength. Understanding these indicators can significantly impact your trading decisions and overall success in the market.
As you navigate the complexities of trend-following indicators, unraveling the intricacies of tools like the Exponential Moving Average (EMA) and Average Directional Index can further refine your strategy.
Stay tuned to discover how integrating these indicators can elevate your trading game and lead to more informed choices in the dynamic world of trading.
Simple Moving Average
The Simple Moving Average (SMA) is a key technical indicator that calculates the average price of an asset over a specific number of price bars, typically utilizing closing prices to assess trend strength accurately. Traders rely on SMAs to gauge trend direction, identifying potential trend reversals or continuations.
However, SMAs may be less effective in rangebound markets where prices lack a clear trend. To enhance analysis and decision-making, traders often combine SMAs with other indicators for a more comprehensive view of the market.
Commonly used periods for SMAs include the 20-day, 50-day, and 200-day averages, offering different insights into price trends. By understanding how SMAs operate and their limitations, traders can make informed decisions based on trend analysis.
Exponential Moving Average
Pivoting from the discussion on the Simple Moving Average, understanding the Exponential Moving Average (EMA) is crucial for traders seeking a more responsive indicator that places greater emphasis on recent price movements. Here are key points about EMA:
- EMA gives more weight to recent price data, making it faster in reflecting current market trends compared to SMA.
- Traders commonly use 20-day, 50-day, and 200-day EMAs to analyze short, medium, and long-term trends respectively.
- EMA crossovers and divergences can signal potential trend changes or continuations in the market, providing valuable insights for decision-making.
Average Directional Index
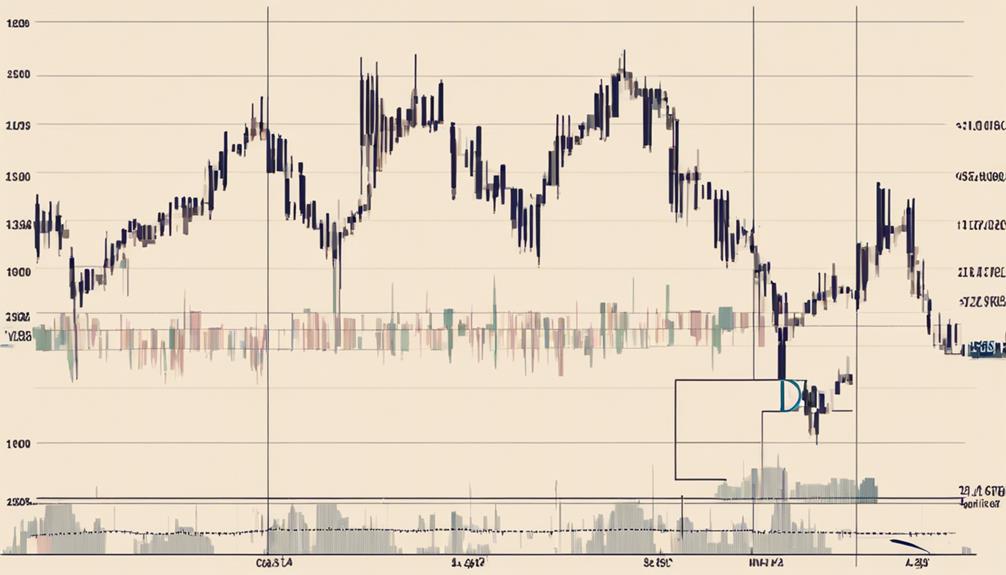
Analyzing market trends efficiently, the Average Directional Index (ADX) measures trend strength in a security through its ADX line and two Directional Movement lines (+DMI and -DMI).
A high ADX value indicates a strong trend, while a low value suggests a weak or sideways market. The crossover of the +DMI above the -DMI signals an uptrend, whereas the opposite indicates a downtrend.
Traders rely on ADX to confirm trends and evaluate their strength before making trading decisions. Understanding the ADX can assist you in recognizing the direction of a trend, whether it's gaining momentum or losing steam, enabling you to make more informed trading choices based on trend confirmation.
Moving Average Convergence-Divergence
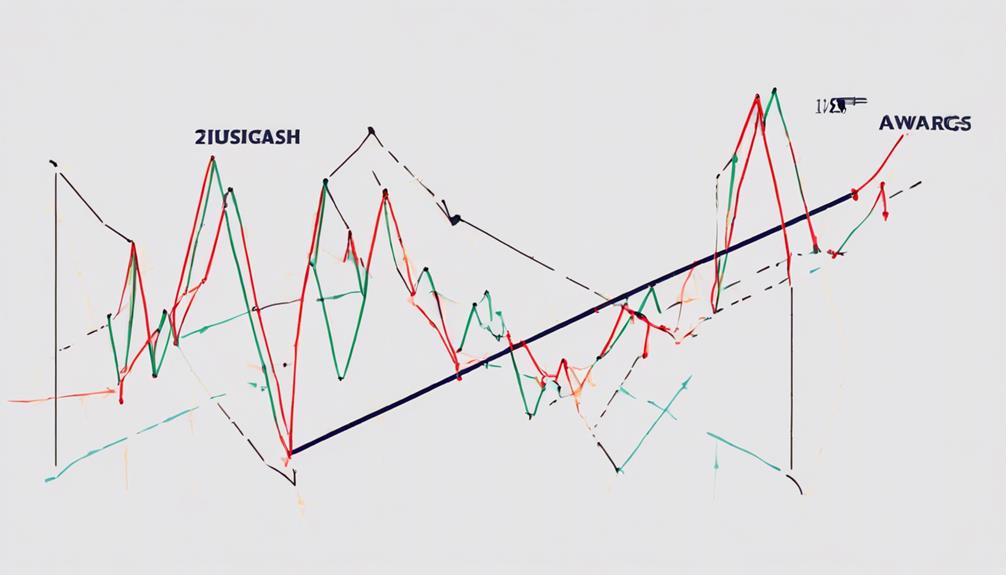
With precision, Moving Average Convergence-Divergence (MACD) was created by Gerald Appel in the 1960s to assess the correlation between various moving averages.
- MACD provides insights into trend direction and momentum through its generated directional lines or histogram.
- Traders utilize MACD for crossovers and divergences, which serve as signals for potential market movements.
- The histogram in MACD indicates the strength of the trend by showing the distance between the MACD line and the signal line.
MACD is a widely used technical indicator for identifying entry and exit points in the market based on moving average convergence and divergence. Its ability to analyze the relationship between moving averages makes it a valuable tool for traders looking to make informed decisions.
Parabolic Stop and Reverse
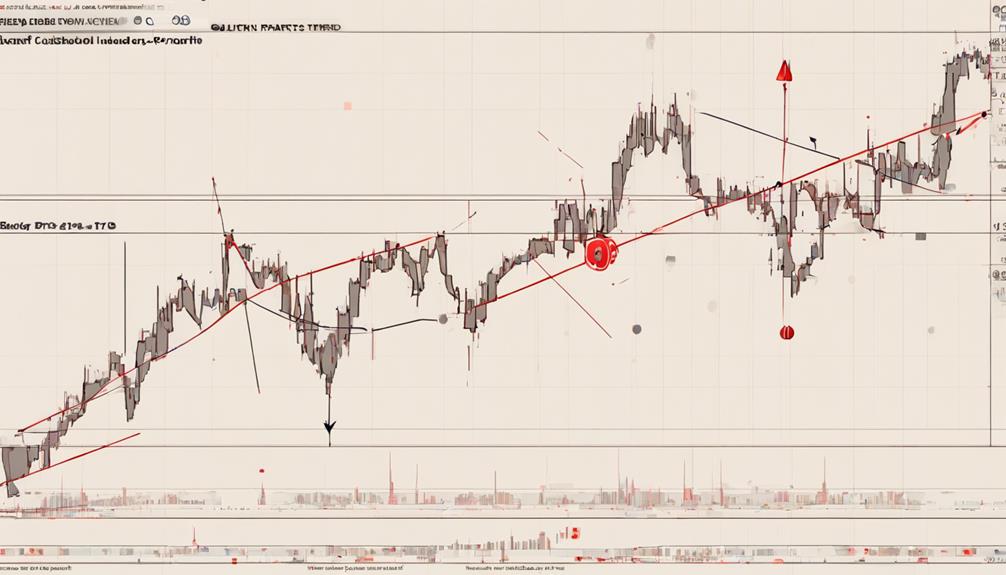
Moving from the Moving Average Convergence-Divergence indicator, the Parabolic Stop and Reverse (SAR) indicator is utilized to confirm trend direction and provide reversal signals based on price action. The Parabolic SAR is most effective in strong trending markets, where it can help traders stay in a position as long as the trend remains intact.
However, in sideways conditions, it may produce false signals due to its nature of trailing the price closely. Traders often combine the Parabolic SAR with other indicators and price patterns to improve its accuracy. Adapting the SAR settings to the specific time frame being traded is crucial for optimal performance.
Understanding how the Parabolic SAR reacts to price movements is essential for identifying potential reversals and making informed trading decisions.
Are there Advanced Techniques for Using Trend Following Indicators?
Yes, there are advanced techniques for using the fundamentals of trend following indicators. Traders can apply trend filters, multiple time frame analysis, and dynamic risk management to enhance the effectiveness of these indicators. By incorporating these advanced techniques, traders can improve their trend following strategies and achieve better trading results in the market.
Frequently Asked Questions
What Are the Basics of Trend Following?
To grasp the basics of trend following, you need to identify market trends and trade in their direction. This strategy aims to profit from momentum by using technical indicators for entry and exit points.
What Are the Indicators for Determining Trend?
To determine trends, rely on moving averages like SMA and EMA for direction. Gauge trend strength with indicators like ADX/DMS and Parabolic SAR. Use MACD for trend confirmation. Explore unique perspectives with Gator Oscillator and Supertrend.
What Is the Indicator of a Trend?
To grasp the basics of trend indicators, focus on recognizing and confirming market direction and strength. Use tools like moving averages and ADX that analyze historical data to project potential price movements. Enhance strategies by combining indicators with technical analysis.
What Is the Best Method to Identify a Trend?
To identify a trend effectively, you should prioritize using reliable indicators like moving averages, ADX, and MACD. These tools offer valuable insights into market trends, guiding your trading decisions with precision. Trust in these indicators to navigate the market terrain confidently.
Conclusion
In conclusion, mastering trend-following indicators is crucial for successful trading. By incorporating tools like the SMA, EMA, ADX, MACD, and Parabolic SAR into your strategy, you can gain valuable insights into market trends and make informed decisions.
For example, imagine using the MACD to pinpoint a trend reversal just in time to maximize profits on a winning trade. Embrace these indicators to navigate the complex world of trading with confidence and precision.