
Feeling overwhelmed by the plethora of MACD indicator strategies out there? Don't worry; we've got you covered.
From basic crossovers to advanced divergence trading, the MACD offers a range of techniques to explore.
But what really sets apart the effective strategies from the rest? Stay tuned to uncover the key principles that could potentially revolutionize your trading game and elevate your success in the markets.
MACD Indicator Overview
In the realm of technical analysis, the MACD indicator serves as a powerful tool for traders seeking insights into market trends and momentum.
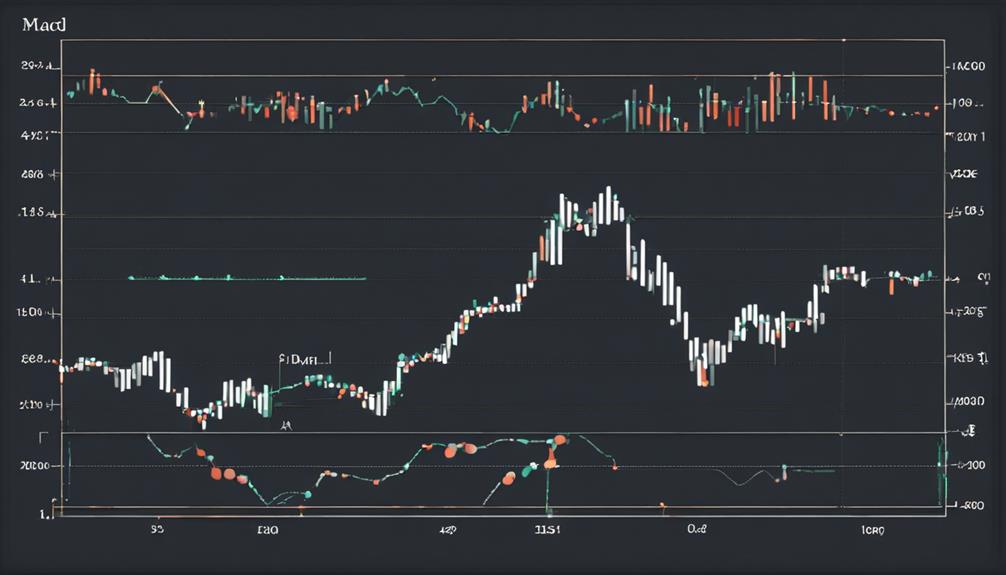
The MACD, short for Moving Average Convergence Divergence, is an indicator that shows the relationship between two moving averages of prices. These moving averages are represented by two lines on the chart. One of these lines is the MACD line itself, while the other is the signal line, which is the nine-day Exponential Moving Average (EMA) of the MACD.
Traders use the MACD to develop strategies for trading in the financial markets, relying on the interactions between these two lines to generate buy or sell signals and make informed decisions.
Crossover Strategy Details
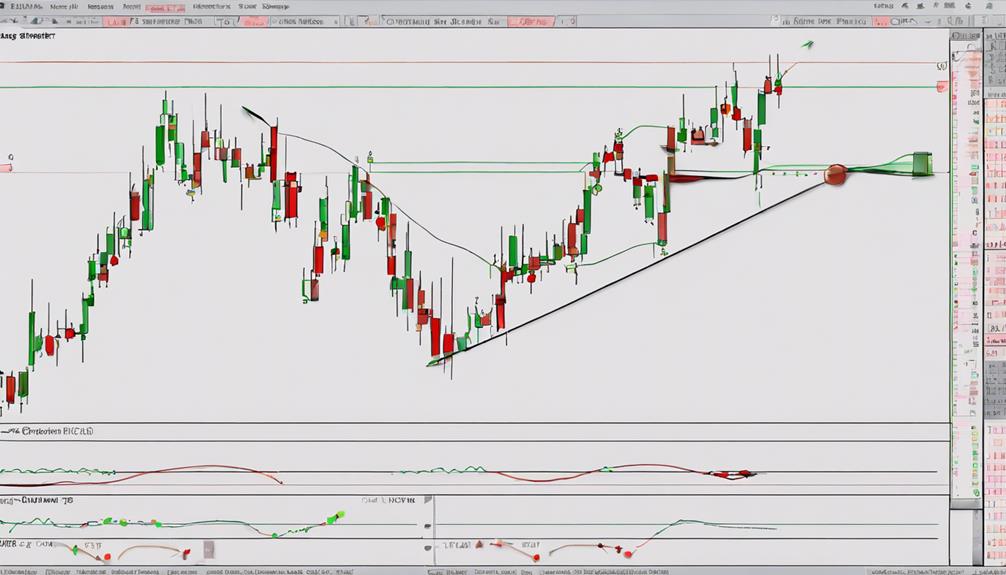
Exploring the nuances of the crossover strategy within the realm of MACD indicator tactics provides traders with a clear framework for interpreting market movements. When delving into the crossover strategy details, keep in mind the following key points:
- Bullish crossovers signal potential upward momentum.
- Bearish crossovers indicate possible downward movement.
- Traders often use crossover signals for decision-making during trend changes.
- The crossover strategy involves the MACD line crossing the signal line.
- It's a popular and effective method for generating trading signals based on MACD indicators.
Histogram Reversal Techniques
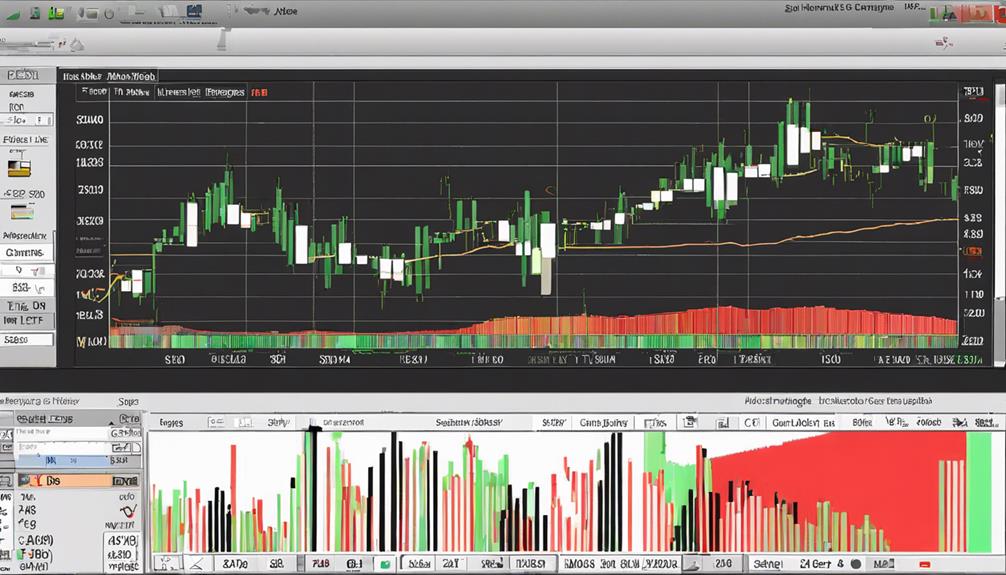
Utilizing histogram bars as a crucial tool, traders employ histogram reversal techniques to analyze the disparity between the MACD and signal line, aiding in predicting market movement strength and potential price reversals.
By observing changes in histogram bars, traders can gain insights into the momentum in the market, helping them anticipate potential price movements and identify ideal entry and exit points. Longer histogram bars indicate stronger momentum, providing guidance on the direction prices may move.
These strategies offer leading signals aligned with emerging trends, allowing traders to stay ahead of the curve compared to conventional crossover signals. Histogram reversal techniques are valuable for traders seeking a deeper understanding of market dynamics and looking to make informed decisions based on price action.
Zero Crosses Method Explained
Employing the Zero Crosses method in MACD involves analyzing EMAs crossing the zero line to forecast new market trends accurately. This method offers reliable signals for predicting trend changes in the market, providing clearer signals for traders looking to make informed decisions with less frequent trading. While it may give slower signals compared to crossover strategies, it significantly reduces false reversals.
Traders can further enhance their analysis by using trendline breaks to confirm exits based on Zero Crosses signals.
- It provides slower signals compared to crossover strategies but with fewer false reversals.
- Traders can use trendline breaks to confirm exits based on Zero Crosses signals.
- Zero Crosses offer a reliable way to anticipate trend changes in the market.
- This method is ideal for traders looking for clearer trend signals with less frequent trading activity.
Divergence Trading Strategies
Divergence trading with MACD reveals inconsistencies between price movements and the indicator, enabling traders to identify potential market opportunities based on these disparities. By recognizing bullish or bearish divergences, where price action contradicts MACD movements, traders can anticipate trend reversals and capitalize on momentum shifts.
Bullish divergence, characterized by lower price lows and higher MACD lows, suggests potential buying points. Conversely, bearish divergence, with higher price highs and lower MACD highs, indicates possible selling opportunities.
Effective strategies in divergence trading involve meticulous analysis of price movements alongside MACD signals to make well-informed trading decisions. By leveraging these divergences, traders can enhance their ability to interpret market dynamics and improve their overall trading outcomes.
Can Newbies Utilize MACD Indicator Strategies Effectively?
Yes, beginners can effectively utilize MACD indicator strategies with the help of an introductory MACD indicator guide. This guide provides step-by-step instructions on how to interpret MACD signals, identify trend changes, and make informed trading decisions. With the right guidance, newbies can confidently incorporate MACD into their trading strategies.
Frequently Asked Questions
What Is the Best MACD Indicator Strategy?
To find the best MACD indicator strategy, focus on the crossover method for clear buying and selling signals. Optimize your MACD settings for day trading success. Combine it with indicators like the RVI for enhanced momentum analysis.
What Is the MACD Secret Strategy?
Delve deep into the MACD Secret Strategy, a powerful tool for traders. Uncover optimal settings such as 24, 52, 9, honing in on market trends and momentum shifts. Combine with RSI and SMA for robust signals.
What Is the Success Rate of MACD Indicator?
The success rate of the MACD indicator can vary based on your trading approach and the market conditions you encounter. Combining MACD with other indicators can enhance signal accuracy and confirmation for better decision-making.
What Is the MACD Combination Strategy?
To understand the MACD combination strategy, you blend MACD with RVI and MFI, creating a powerhouse trio. This exaggeration might grab attention and excite you to explore how this trio can revolutionize your trading game.
Conclusion
In conclusion, mastering effective MACD indicator strategies is like navigating a financial maze with a trusty compass. By utilizing crossover signals, histogram reversals, and zero crosses, you can confidently steer your trading decisions in the right direction.
Keep an eye out for divergence patterns and consider combining MACD with other indicators for a more comprehensive view of market trends. With these tools in your arsenal, you'll be better equipped to navigate the complexities of the financial landscape.