
As you embark on your journey to master MACD Indicator Investing, you will find that unraveling the intricacies of this powerful tool can lead you to new heights in your trading endeavors.
The MACD indicator holds a wealth of potential for savvy investors looking to leverage market momentum, but unlocking its full capabilities requires a keen understanding of its nuances.
By exploring the depths of MACD analysis, you are poised to uncover a world of strategic possibilities that could elevate your trading acumen to unprecedented levels.
Understanding MACD Indicator Basics
To grasp the fundamentals of the MACD indicator, you must understand its components and their significance in technical analysis.
The MACD line, a crucial element, is derived from subtracting the 26-day Exponential Moving Average (EMA) from the 12-day EMA. This line reflects the relationship between short-term and long-term price trends.
The signal line, calculated as a 9-day EMA of the MACD line, acts as a trigger for buy or sell signals.
Additionally, the MACD histogram illustrates the variance between the MACD line and the signal line, aiding in the identification of potential shifts in momentum.
This knowledge equips you with the ability to assess trend strength, direction, and potential entry or exit points when trading stocks.
MACD Formula and Calculation Explained
Understanding how the MACD indicator is calculated provides insight into its application in technical analysis. The Moving Average Convergence/Divergence (MACD) is derived by subtracting the 26-period Exponential Moving Average (EMA) from the 12-period EMA.
The signal line, a 9-day EMA of the MACD line, is crucial for generating buy and sell signals. Positive MACD values indicate a bullish trend when the 12-period EMA is above the 26-period EMA, while negative values suggest a bearish trend.
MACD crossovers, where the MACD line crosses the signal line, are used as trend-following indicators. Additionally, MACD divergence highlights potential shifts in the price trend, aiding traders in identifying possible reversals.
Interpreting MACD Crossovers and Divergence
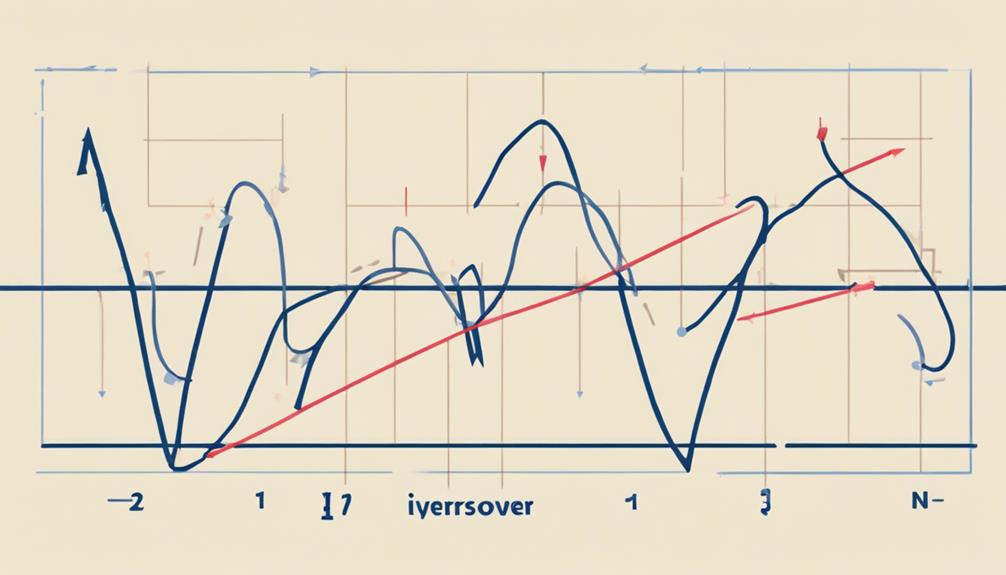
Interpreting MACD crossovers and divergence provides traders with vital signals for identifying potential changes in market momentum and trend direction.
MACD crossovers occur when the MACD line crosses above (bullish crossover) or below (bearish crossover) the signal line, indicating possible uptrends or downtrends.
MACD divergence, seen when the price trend and MACD indicator move oppositely, can signal a potential trend reversal. Traders often rely on these signals to make informed buy or sell decisions in the market.
Understanding the interplay between the MACD line, signal line, crossovers, and divergence can help you gauge momentum shifts and anticipate trend changes for strategic investment moves.
Strategies for MACD Indicator Investing
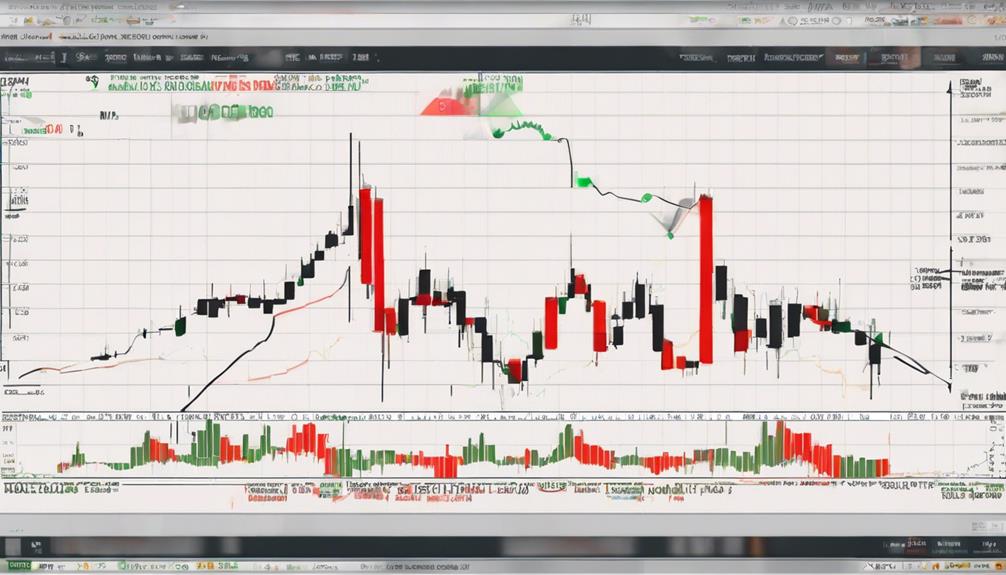
In MACD Indicator Investing, strategic utilization of MACD crossovers and divergences can enhance your decision-making process for effective market participation. When considering MACD strategies, focus on the following key points:
- Utilize MACD crossovers to generate buy/sell signals based on the relationship between the 12-day and 26-day EMAs.
- Look for divergences between price and MACD to predict potential trend reversals or turning points.
- Pay attention to extreme readings on the MACD histogram to identify overbought or oversold market conditions.
Overcoming Common MACD Indicator Pitfalls
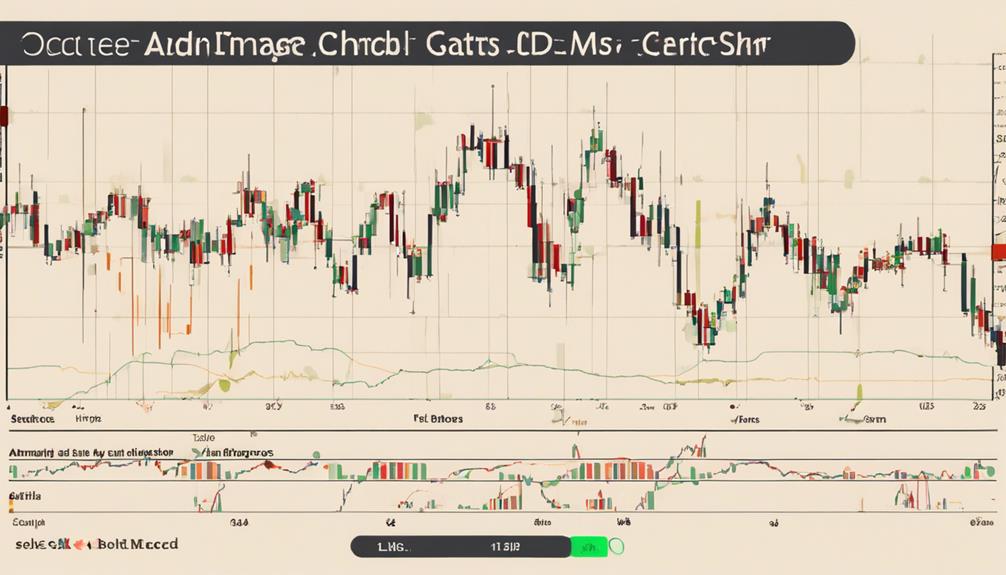
To navigate the complexities of MACD Indicator Investing successfully, one must be mindful of the common pitfalls that can hinder accurate decision-making. Misinterpreting MACD crossovers can lead to false signals, impacting trade outcomes.
In range-bound markets, using MACD may result in unreliable trends and whipsaw signals, causing confusion for traders. Enhance your winning rate by aligning trades with the higher timeframe trend and utilizing MACD crossovers for precise entry signals.
Incorporate MACD into your strategies for both long and short setups to improve trade accuracy and profitability. Avoid chasing breakouts by analyzing market structure thoroughly and utilizing the MACD histogram squeeze for breakout trades and low volatility signals, ensuring a more strategic approach to your investments.
Can the MACD Indicator be Applied to Cryptocurrency Investing?
When it comes to analyzing cryptocurrency with MACD indicator, it can be a valuable tool for investors. The MACD indicator can help identify potential buying and selling opportunities in the highly volatile cryptocurrency market. By understanding the signals provided by the MACD, investors can make more informed decisions when trading cryptocurrencies.
Frequently Asked Questions
What Is the Best MACD Indicator Strategy?
For the best MACD indicator strategy, use default settings of 12-day and 26-day EMAs. Incorporate the 9-day EMA signal line for buy/sell signals. Watch for divergences to predict trend reversals and use extreme MACD histogram readings to identify overbought/oversold conditions.
Do Professional Traders Use Macd?
Professional traders use MACD extensively. It aids in spotting trend shifts, gauging momentum, and determining entry/exit points. They rely on MACD crossovers and divergences for informed decisions, finding its clear signals invaluable for market analysis.
What Indicators Should I Use With Macd?
To enhance your MACD analysis, consider using RSI for overbought/oversold signals, ADX for trend confirmation, Moving Average for trend-following cues, and Stochastic Oscillator for momentum analysis. Combining these indicators with MACD strengthens your technical strategy.
What Are the 3 Components of MACD Indicator?
To understand the MACD indicator, focus on its three key components: the MACD line, signal line, and MACD histogram. These elements track market trends, offering insights on momentum and potential shifts for informed investing decisions.
Conclusion
After diving into the world of MACD indicator investing, you now have the tools to make more informed decisions and enhance your trading outcomes.
By understanding the basics, formulas, interpretation, and strategies, you can effectively navigate the market and capitalize on trend changes and entry/exit points.
Remember to stay vigilant for confirmation signals and pitfalls to maximize the effectiveness of the MACD indicator in your investment journey.