
When navigating the realm of trend following indicators, imagine these tools as your compass guiding you through the fluctuations of the market.
Unravel the mysteries behind moving averages, MACD, and more to uncover the secrets they hold for your trading success.
But remember, understanding the basics is just the beginning; the real value lies in how you interpret and apply these indicators in your trading journey.
It's time to unlock the potential of trend following indicators and elevate your trading game to new heights.
Simple Moving Average (SMA)
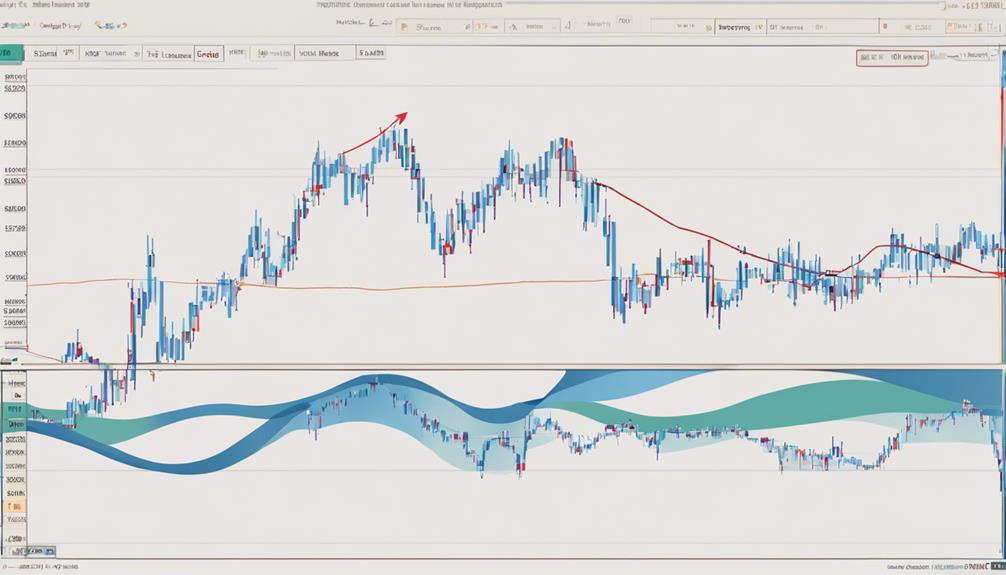
When analyzing market trends, the Simple Moving Average (SMA) serves as a key tool in trading for smoothing price data and identifying crucial support and resistance levels. SMA calculates the average price of a security over a specific period by summing up closing prices and dividing by the number of periods.
Traders commonly use the 50-day and 200-day SMAs as part of a trend-following strategy to determine long-term trends and potential reversal points. The SMA is a lagging indicator that helps traders assess the overall direction of a security's price movement.
Additionally, SMA crossovers, like when shorter-term SMAs cross above or below longer-term SMAs, can signal possible changes in trend direction. This makes SMA widely used in technical analysis for its effectiveness in trend identification.
Exponential Moving Average (EMA)
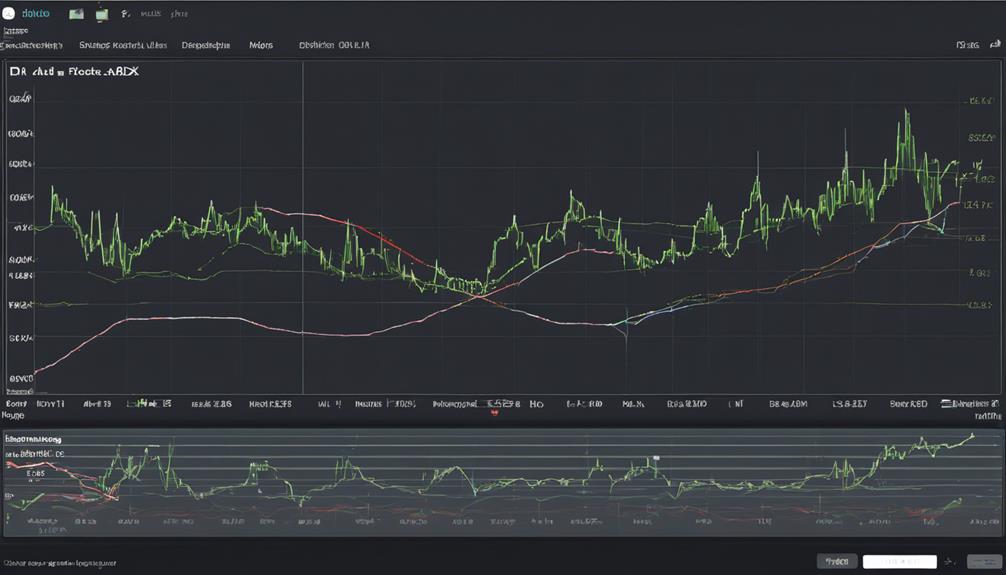
In trend analysis, transitioning from the Simple Moving Average (SMA) to the Exponential Moving Average (EMA) introduces a more responsive indicator that assigns greater significance to recent price movements. EMA gives more weight to recent price data compared to SMA and responds quickly to price changes, making it more reactive.
Traders often use 20-day, 50-day, and 200-day EMAs for trend analysis. EMA crossovers can signal potential trend changes or continuations. This makes EMA effective for capturing short to medium-term price trends, allowing traders to react faster to evolving market conditions and potentially capitalize on short-lived opportunities.
Average Directional Index (ADX/DMS)
Transitioning from the Exponential Moving Average (EMA) to the Average Directional Index (ADX/DMS) provides traders with a robust tool for measuring trend strength and momentum in the market. ADX measures trend strength on a scale of 0-100 using moving averages, where values above 25 indicate a developing trend.
When the positive Directional Movement Indicator (+DMI) is above the negative Directional Movement Indicator (-DMI), it signals uptrend strength in ADX. Traders use ADX to identify the current strength of a trend and its momentum direction. ADX values at or below 25 indicate a weak trend, while higher values signify a robust trend.
This indicator aids traders in setting stop-loss levels, determining trend lines, and deciding whether the market is bullish or bearish.
Moving Average Convergence-Divergence (MACD)
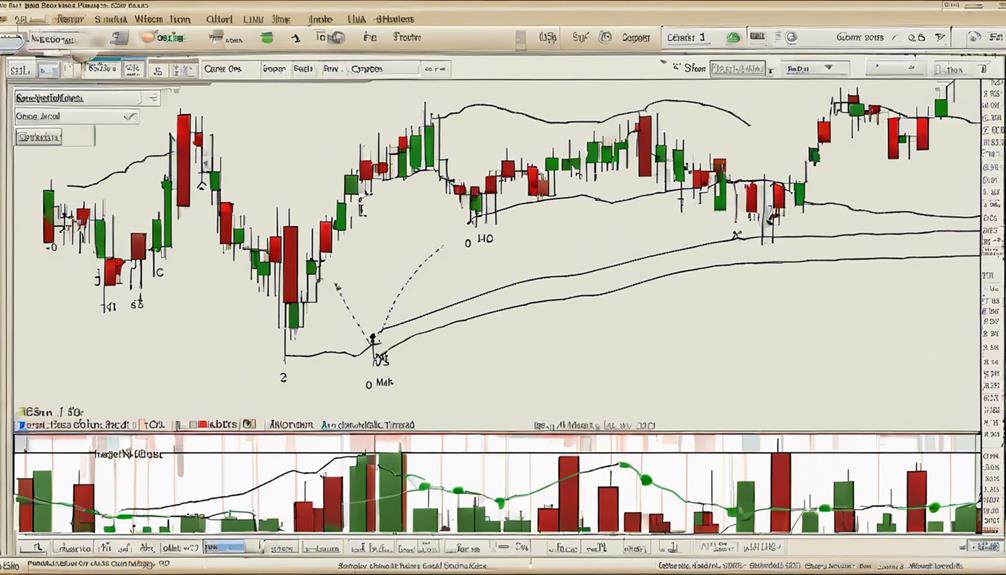
Moving Average Convergence-Divergence (MACD), developed by Gerald Appel in the 1960s, is a widely used indicator in analyzing moving averages' relationships. MACD generates crossovers, divergences, and directional swings based on different interval moving averages. The MACD histogram is commonly used for visual representation and analysis.
- Crossovers above or below the zero line provide buy/sell signals for traders.
- MACD is a popular trend-following indicator that helps identify potential entry and exit points in the market.
- Traders often use MACD to determine support or resistance levels and implement swing trading strategies effectively.
Parabolic Stop and Reverse (Parabolic SAR)
Parabolic Stop and Reverse (Parabolic SAR) is a technical indicator that identifies potential trend reversals in the market by generating dots above or below price to signal changes in trend direction. The SAR indicator is commonly used in various trading strategies to determine the strength and direction of a current trend. It adjusts dynamically with price movement and can be applied across different time frames.
The dots produced by Parabolic SAR switch positions when the trend reverses, aiding traders in making informed decisions for entry and exit points. Traders often consider the Lowest Low of the current trend when using Parabolic SAR to assess potential stop-loss levels or trailing stops for their positions.
Can Volume-Based Indicators Be Used in Conjunction with Trend Following Indicators?
When it comes to analyzing market trends, the best volumebased indicators study can be used in conjunction with trend-following indicators to provide a comprehensive view of market behavior. By incorporating volume-based indicators into trend analysis, traders can gain a more nuanced understanding of market dynamics and make better-informed decisions.
Frequently Asked Questions
What Is the ABC Trend Analysis?
The ABC Trend Analysis identifies market trends through A, B, and C waves, representing short, medium, and long-term strength. It helps visualize market direction and strength across time frames. Traders use it to make informed decisions.
What Is the ABC Technique in Trading?
In trading, the ABC technique involves assessing short, medium, and long-term trend strengths through specific waves. A, B, and C waves signify different time frames, aiding traders in visualizing market direction and making informed decisions.
What Is the ABC Pattern?
You spot the ABC pattern – A, B, and C waves riding the market waves. A roadmap to trends, entry, and exit points. Each wave's colors reveal strength, guiding your moves in this trading dance.
What Is ABC Strategy?
The ABC strategy entails identifying trends through waves A, B, and C on various timeframes. It guides entry and exit points based on zero line intersections. Used for short-term trading, it confirms signals from other indicators for better decisions.
Conclusion
In conclusion, mastering trend following indicators like SMA, EMA, ADX, MACD, and Parabolic SAR is crucial for successful trading.
Did you know that a study found that combining multiple indicators can increase trading accuracy by up to 70%?
By utilizing these tools effectively, traders can enhance their decision-making process, identify trends, and manage risks more efficiently, ultimately leading to improved trading outcomes.