
When using the MACD indicator, have you ever wondered about the most effective strategies for maximizing its potential?
Crossovers, histogram reversals, and zero crosses are just the tip of the iceberg when it comes to leveraging this powerful tool in your trading arsenal.
Understanding how to utilize these strategies can significantly impact your decision-making process and ultimately lead to more profitable trades.
But what makes these strategies stand out among the rest?
MACD Indicator Overview
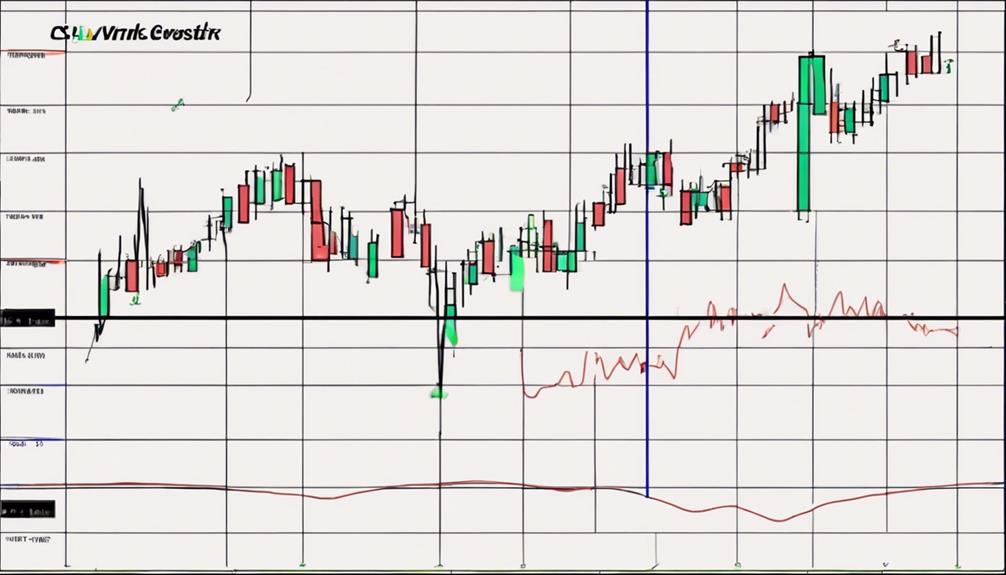
In the realm of technical analysis, the MACD Indicator, developed by Gerald Appel, is a robust tool for traders to assess trends, momentum, and potential market reversals. Comprising the MACD line, signal line, and histogram, it offers insights into market dynamics.
Calculated by the difference between short-term and long-term Exponential Moving Averages (EMAs), the MACD emphasizes trend momentum. Traders frequently combine the MACD with other technical indicators such as Stochastic and moving averages for more precise trading signals and confirmation.
This indicator is widely used in various financial markets due to its ability to pinpoint changes in trend strength, direction, momentum, and duration, making it a valuable asset in traders' strategies.
MACD Crossover Strategy
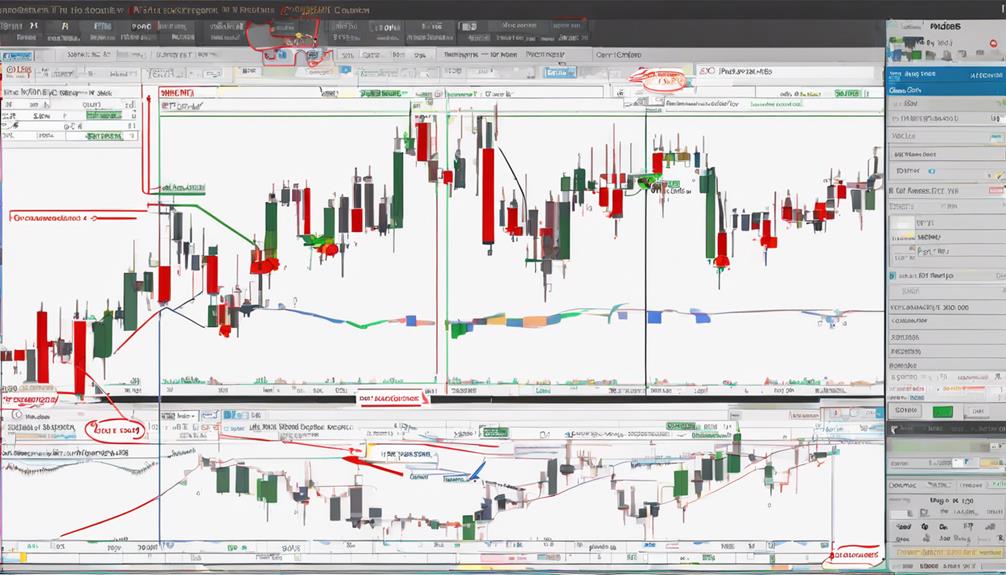
Utilize the MACD Crossover Strategy to capitalize on buy and sell signals generated when the MACD line crosses the signal line.
- Bullish and Bearish Signals: Identify uptrends with bullish crossovers (MACD line crossing above the signal line) and downtrends with bearish crossovers (MACD line crossing below the signal line).
- Technical Analysis Integration: Combine MACD crossovers with other indicators for confirmation before executing trades.
- Effective Trading Strategy: Utilize MACD crossovers as part of a comprehensive trading plan to enhance decision-making and improve overall trading performance.
MACD Histogram Reversal Strategy
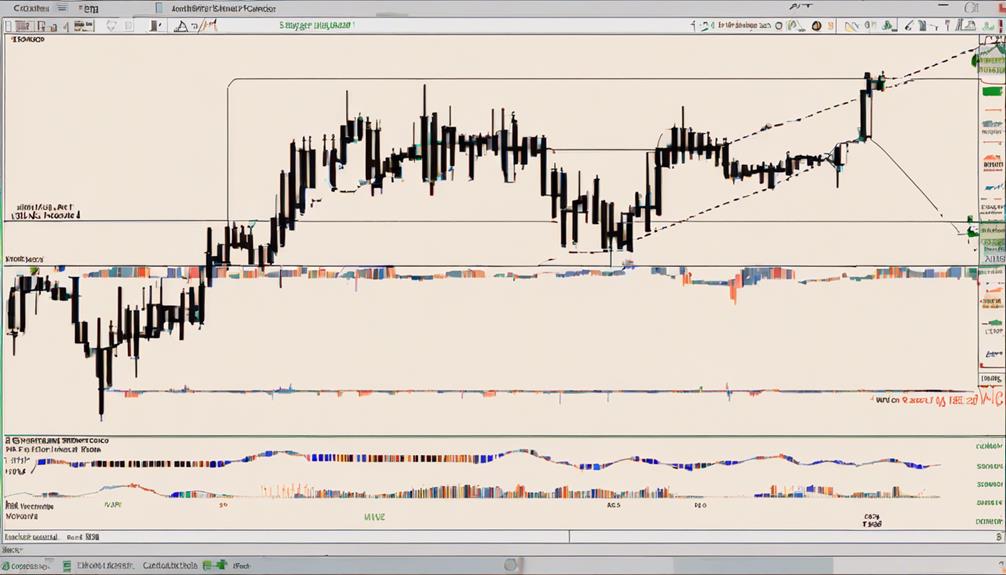
Implementing the MACD Histogram Reversal Strategy allows traders to analyze market momentum shifts through histogram bar reversals. Traders utilize bullish reversals in the histogram bars to identify potential upward trend shifts, while bearish reversals indicate possible downward movement.
This strategy serves as a leading indicator for early trend detection and trade entries, providing insights into market direction changes. By focusing on the MACD histogram, traders can anticipate shifts in momentum and make informed trading decisions.
The MACD Histogram Reversal Strategy is a valuable tool within the realm of technical analysis, offering a method for spotting trend reversals and capturing opportunities in the market using the MACD indicator.
MACD Zero Cross Strategy
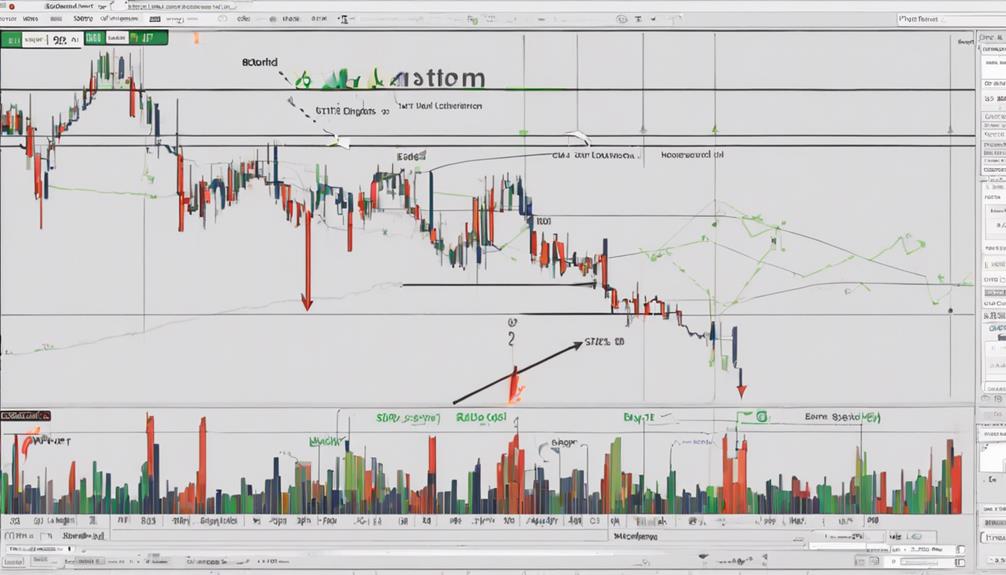
When employing the MACD Zero Cross Strategy, traders analyze trend changes by observing the zero line for signals of market direction shifts. This strategy focuses on zero line crossovers to determine potential bullish or bearish signals, indicating the start of new trends in MACD trading.
Here are three key points to consider:
- Look for the MACD line to cross above the zero line for a bullish signal.
- Conversely, crossing below the zero line indicates a bearish signal in the MACD Zero Cross Strategy.
- Utilizing the zero line in MACD trading provides clear signals for trend direction changes, aiding traders in making informed decisions.
Timing MACD Indicator Usage
For effective utilization of the MACD indicator, understanding the optimal timing for its application is crucial. This alignment with your trading strategy and monitoring preferences is influenced by the market, price movements, and financial indicators. The MACD usage depends on whether you choose a lagging or leading strategy. Lagging strategies, relying on moving average crossovers, require more frequent checks for signals. On the other hand, leading strategies like the histogram can offer early indications, reducing the need for constant vigilance.
Therefore, traders must align their MACD usage with their specific approach and monitoring capabilities to maximize the benefits of this versatile financial tool.
Can You Explain the Top Strategies for Using the MACD Indicator in More Detail?
When it comes to using the MACD indicator, it’s crucial to understand the best reading MACD strategies. These include using crossovers, divergence, and histogram patterns to identify potential buy or sell signals. By mastering these strategies, traders can make more informed decisions and improve their overall trading performance.
Frequently Asked Questions
What Is the Best Strategy to Use With Macd?
For the best strategy with MACD, consider your risk tolerance, style, and market conditions. Options include crossovers, histogram reversals, and combining with RSI or SMA. Customize settings and experiment to find what suits your goals.
What Is the Best Input for MACD Indicator?
For the MACD indicator, stick to the common 12, 26, 9 settings to start. Experiment with 24, 52, 9 for a smoother line. Adjusting inputs based on timeframe can refine accuracy. Tailoring settings to your style boosts effectiveness.
What Is the Most Accurate MACD Settings?
For the most accurate MACD settings, stick with default values of 12, 26, 9 for the fast and slow EMA periods and signal line. Adjusting can impact signal frequency and responsiveness. Experiment and backtest to find what suits your style best.
What Is the Best Moving Average to Use With Macd?
When trading with MACD, the 12-period EMA and 26-period EMA are the top moving averages to use. They form the MACD line, essential for market analysis. Combining these EMAs provides a balanced view for trend direction.
Conclusion
In conclusion, using the MACD indicator in your trading strategy is like having a compass in a vast ocean. It provides direction and guidance in navigating the turbulent waters of the market.
By implementing the MACD crossover, histogram reversal, and zero cross strategies, traders can confidently make informed decisions and improve their trading outcomes.
Remember, just like a skilled sailor relies on their compass, mastering the MACD indicator can lead you to success in the trading world.