
When it comes to boosting your profits with the Aroon Indicator, you need to grasp the key strategies that can give you a competitive edge in the market.
By understanding how to time your trades effectively and capitalize on trend changes, you can significantly enhance your trading outcomes.
But what are these strategies exactly, and how can they help you navigate the complexities of the market to secure consistent gains?
Let's explore the top five approaches that can elevate your trading game and pave the way for optimal profitability with the Aroon Indicator.
Aroon Indicator Overview and Benefits
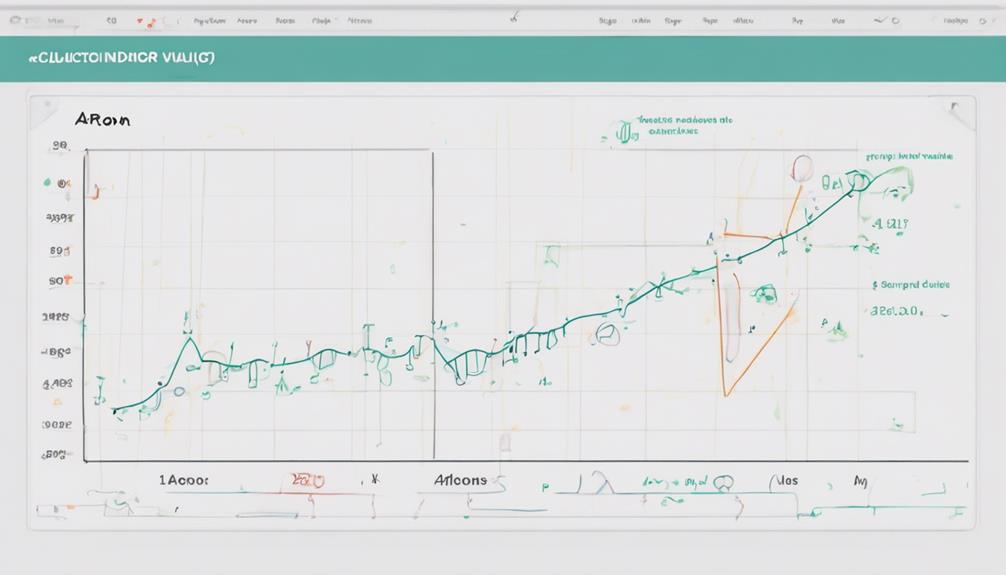
Exploring the Aroon Indicator provides traders with a powerful tool for assessing trend strength and direction in the market. The Aroon indicator consists of two lines, Aroon-Up and Aroon-Down, which track the time since the last high and low, respectively.
By analyzing these lines, traders can gain insights into market sentiment and potential trend changes. Aroon readings range from 0 to 100, with values exceeding 50 indicating strong trends and the possibility of new highs or lows.
Additionally, Aroon crossovers, where Aroon-Up crosses above Aroon-Down, signal bullish trends, while readings below 50 suggest consolidation phases.
Utilizing the Aroon indicator alongside other tools can enhance trend identification accuracy and optimize trading strategies for profit maximization.
Aroon Indicator Calculation Explained
To understand the Aroon Indicator Calculation, traders need to grasp the specific formulae used to derive the Aroon Up and Aroon Down values. Here are some key points to consider:
- Aroon Up is calculated by ((Number of periods – Number of periods since the highest high) / Number of periods) * 100%.
- Aroon Down is calculated by ((Number of periods – Number of periods since the lowest low) / Number of periods) * 100%.
- The default period setting for the Aroon Indicator is 14 periods, ideal for short-term trend analysis.
- Longer periods, like 25-30, are recommended for conducting long-term trend analysis with the Aroon Indicator.
Understanding these calculations can provide valuable insights into trend strength and direction based on the Aroon Indicator lines.
Interpreting Aroon Indicator Signals
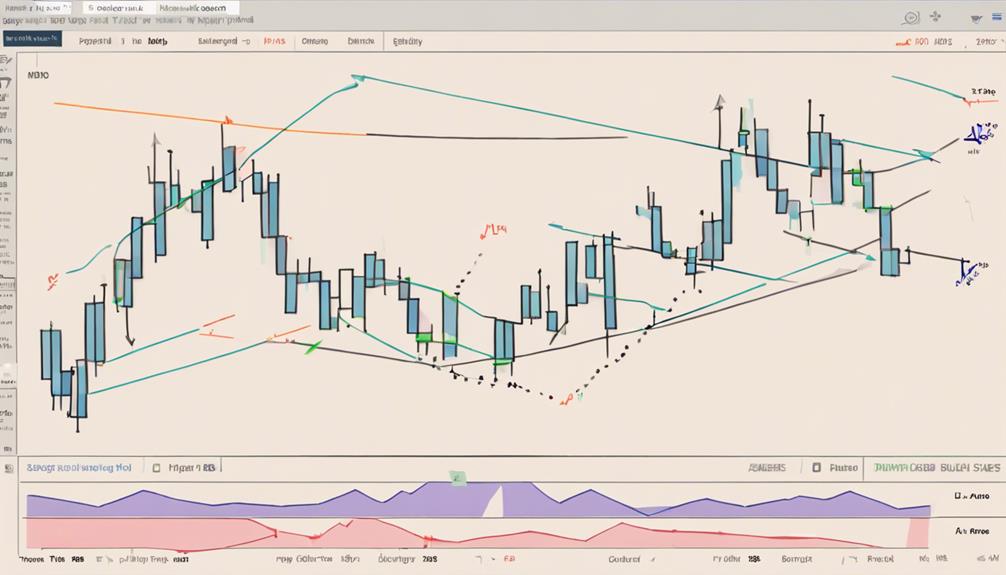
When interpreting Aroon Indicator signals, pay close attention to the relationship between Aroon-Up and Aroon-Down values for actionable insights on trend direction.
Aroon-Up crossing above Aroon-Down signifies a bullish trend, while Aroon-Down above 50 indicates a strengthening bearish trend.
Conversely, when both Aroon-Up and Aroon-Down are below 50, it suggests a consolidation phase in the market.
Utilize Aroon crossovers for potential buy or sell signals depending on the trend direction.
Readings below 50 on Aroon indicators often indicate flat prices or trading ranges, making it crucial to watch for these signals to make informed trading decisions.
Understanding these key points will help you interpret Aroon Indicator signals effectively for maximizing profits.
Advanced Aroon Indicator Trading Strategies
Implement effective Aroon indicator trading strategies by combining technical analysis with precise trend identification for optimized trading outcomes. When using the Aroon Indicator, consider the following advanced strategies:
- Utilize Aroon indicator crossovers to capture bullish or bearish signals effectively.
- Incorporate other technical indicators to validate trade entries and exits alongside the Aroon Indicator.
- Identify trend strengths by closely examining Aroon-Up and Aroon-Down values nearing 100.
- Capitalize on market movements by anticipating trend reversals using the Aroon Indicator, thus maximizing profits.
Maximizing Profits With Aroon Indicator
By leveraging the Aroon Indicator effectively, traders can strategically maximize profits through informed trend analysis and timely trade executions. The Aroon Indicator helps identify trend strength and potential reversals, enabling traders to implement breakout trading strategies based on Aroon crossovers for profitable opportunities.
By combining the Aroon Indicator with other technical indicators like moving averages, traders can make more accurate trading decisions. Utilizing the Aroon Oscillator aids in determining trend direction and entry/exit points, crucial for optimizing profit potential.
It's essential to incorporate risk management strategies when using the Aroon Indicator to minimize losses and maximize gains in trading activities. Make informed trading decisions using the Aroon Indicator to enhance profitability.
How Can the Aroon Indicator Help Maximize Profits in Stock Trading?
The aroon indicator stock trading tips can help investors maximize profits by identifying trends and potential trend reversals in the stock market. By using this technical analysis tool, traders can make informed decisions on when to buy or sell stocks, ultimately increasing their chances of success in the market.
Frequently Asked Questions
What Is the Success Rate of the Aroon Indicator?
The Aroon Indicator boasts a success rate of approximately 70-80% in pinpointing trends and reversals accurately. When utilized with other indicators for confirmation, it enhances decision-making and profitability for traders, adapting to market conditions.
Is Aroon a Leading Indicator?
Aroon isn't a leading indicator; it follows price action. It gauges trend strength & direction post-start. Crossovers hint at possible trend shifts. Confirm with other indicators. Though not predictive, when combined with leading indicators, Aroon can enrich trading insights.
How Do You Use an Aroon Oscillator?
To use an Aroon Oscillator effectively, identify trend strength with Aroon Up and Aroon Down values. Watch for crossovers and zero line interactions for potential trend shifts. Customize settings for your strategy. Aroon Oscillator guides entry and exit in trend-following approaches.
How Do You Use Awesome Oscillator in Trading Strategy?
To use the Awesome Oscillator in your trading strategy, watch for shifts from positive to negative values. Buy when it turns positive for bullish momentum and sell when it goes negative for bearish momentum. Timing is crucial.
Conclusion
By mastering the Aroon indicator and implementing advanced trading strategies, you can significantly increase your profits in the market.
Did you know that traders who effectively combine the Aroon indicator with other technical indicators can improve their success rate by up to 30%?
Don't miss out on this powerful tool for maximizing your trading profits and achieving your financial goals.
Start utilizing the Aroon indicator today for better trading outcomes.