
When considering the performance of a particular stock, imagine this scenario:
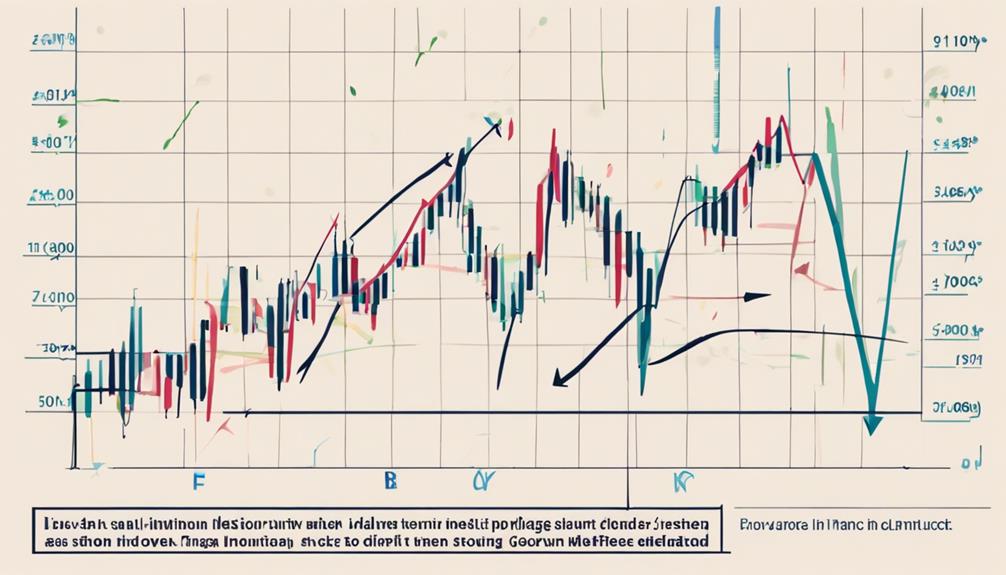
You observe the price of Company X steadily rising over the past few weeks, prompting you to consider whether to enter a position based on the momentum or the trend.
As you ponder this decision, it becomes crucial to understand how these indicators differ and which one may be more suitable for your trading strategy.
By delving into the nuances of momentum versus trend indicators, you can gain a clearer perspective on how to navigate the complexities of the market and optimize your trading approach.
Key Differences Between Momentum and Trend Indicators
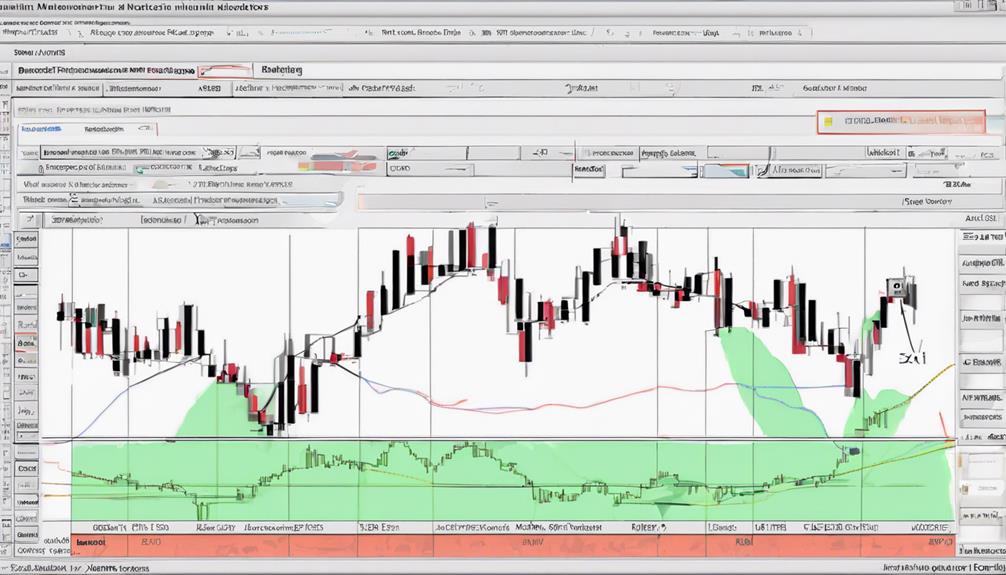
When distinguishing between momentum and trend indicators in technical analysis, it's crucial to understand their distinct roles in assessing market dynamics. Momentum indicators, such as RSI and MACD, focus on the speed and strength of price changes. They help identify overbought/oversold conditions and potential reversals based on recent price movements.
On the other hand, trend indicators, like moving averages and trendlines, analyze the direction and persistence of price movements over time. They provide insight into the broader trend direction. Divergence between price and momentum signals in momentum indicators can signal potential trend reversals, while trend indicators emphasize the consistency of price movements.
Combining these indicators offers a more comprehensive view of market dynamics and potential trading opportunities.
Advantages of Using Momentum Indicators
To fully grasp the benefits of utilizing momentum indicators in technical analysis, understanding how they complement trend indicators is essential. Momentum indicators play a crucial role in identifying market reversal points based on the strength of movement, regardless of the direction.
They assist in confirming trends, measuring the rate of price change, and pinpointing overbought or oversold conditions. By incorporating popular momentum indicators like RSI, MACD, and Stochastic Oscillator, you can make more informed trading decisions. These indicators not only help in identifying potential trend reversals through divergence between price and momentum but also enhance your ability to interpret market dynamics and anticipate shifts effectively.
Utilizing momentum indicators alongside other technical tools can provide a comprehensive view of market conditions for strategic decision-making.
Understanding Divergence in Indicators

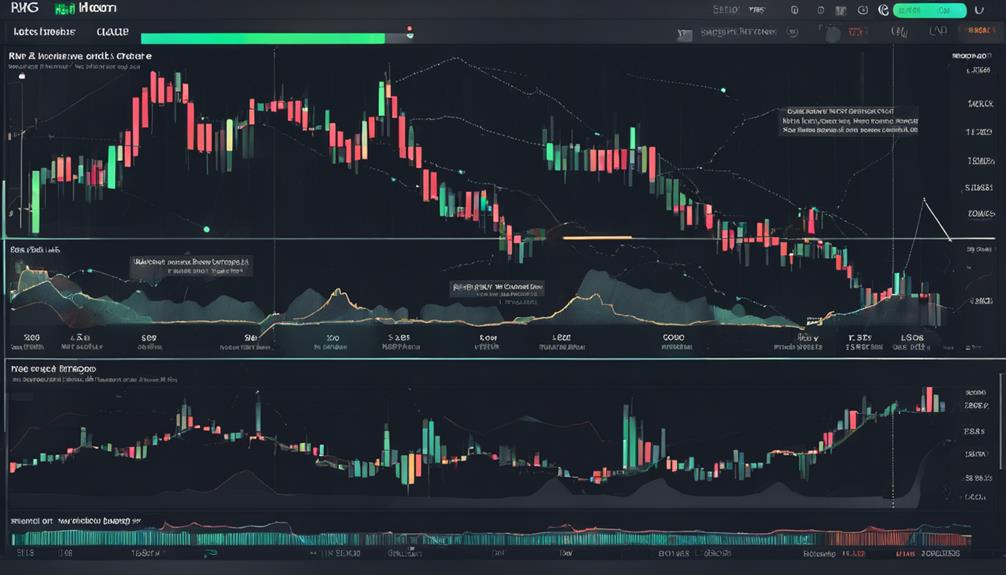
Understanding Divergence in indicators reveals critical insights into potential market shifts and trend reversals based on the relationship between price movements and indicator signals. Divergence occurs when the price trend and indicator signals move in opposite directions, indicating possible weaknesses in the current trend and the potential for a reversal.
Bullish divergence is identified when prices rise while the indicator falls, suggesting an upcoming upward price movement. Conversely, bearish divergence is recognized when prices fall as the indicator rises, signaling a potential downward price movement.
Analyzing divergence is essential for traders as it aids in identifying potential trend reversals and making informed decisions. By paying attention to these divergence signals, traders can better anticipate changes in market direction.
Popular Trend Indicators in Technical Analysis
Some popular trend indicators in technical analysis include Moving Average Convergence Divergence (MACD), Average Directional Index (ADX), Parabolic SAR, Bollinger Bands, and the Ichimoku Cloud indicator.
- Moving Average Convergence Divergence (MACD): Identifies trend direction and momentum shifts.
- Average Directional Index (ADX): Measures trend strength and presence in the market.
- Parabolic SAR: Provides potential reversal points in a trending market.
- Bollinger Bands: Assess volatility and potential price breakouts within a trend.
- Ichimoku Cloud indicator: Offers a comprehensive view of support, resistance, and trend direction.
Practical Application of Momentum and Trend Indicators
When applying momentum and trend indicators in trading, it's essential to understand how these tools complement each other to provide a holistic view of market behavior. By combining momentum indicators like RSI and MACD with trend indicators such as moving averages and flag patterns, traders can develop a robust momentum strategy that accounts for both speed and direction of price movements.
Technical indicators offer valuable insights into market dynamics, helping traders identify trend strength, potential reversals, and optimal entry or exit points. Adopting a trend-following approach supported by momentum indicators can enhance decision-making and improve overall trading performance. Utilizing a blend of these technical tools empowers traders to navigate complex market conditions with greater confidence and precision.
How Do Momentum Indicators Differ from Trend Indicators in Technical Analysis?
Momentum indicators measure the speed of price movements, indicating the strength of a current trend. On the other hand, trend indicators identify the direction of the market trend over time. While momentum indicators focus on the rate of change, trend indicators emphasize the overall direction of the market. When interpreting momentum indicator signals, traders look for potential shifts in market momentum.
Frequently Asked Questions
What Is the Difference Between Momentum Indicators and Trend Indicators?
In trading, momentum indicators gauge price change speed, while trend indicators focus on direction and persistence. Momentum indicators like RSI spot overbought/oversold conditions, while trend indicators such as moving averages confirm trend direction. Both provide valuable insights for decision-making.
What Is the Best Technical Indicator for Momentum?
For the best momentum indicator, consider the Relative Strength Index (RSI). It evaluates recent price changes to predict market direction and strength. RSI is widely used for its effectiveness in assessing momentum trends, aiding traders in decision-making.
What Is the Difference Between Momentum and Trend-Following?
In trading, you need to distinguish between momentum and trend-following strategies. Momentum focuses on price speed, while trend-following looks at price direction. Knowing these differences helps you choose the right approach for your trades.
What Is the Best Period for Momentum Indicator?
For the best momentum indicator, consider a period between 14 to 30 days. Shorter periods offer quicker signals to recent price changes, while longer periods provide smoother indications. Experiment with different periods to find the right balance for your trading strategy.
Conclusion
You've learned the key differences between momentum and trend indicators, the advantages of using them, and how to spot divergence.
Did you know that combining multiple indicators can increase trading success by up to 30%?
Keep in mind the practical applications discussed to make informed decisions and effectively manage risks in your trading strategies.
Remember, risk management is crucial before implementing any trading strategy.
Stay informed and trade smart!