
If you're navigating the world of day trading, mastering Bollinger Bands could be your compass to profitable trades.
Understanding how to interpret the signals these bands provide can be a game-changer in your trading strategy.
By honing your skills in recognizing patterns and utilizing this technical indicator effectively, you could unlock a potential edge in the fast-paced world of day trading.
Understanding Bollinger Bands Basics
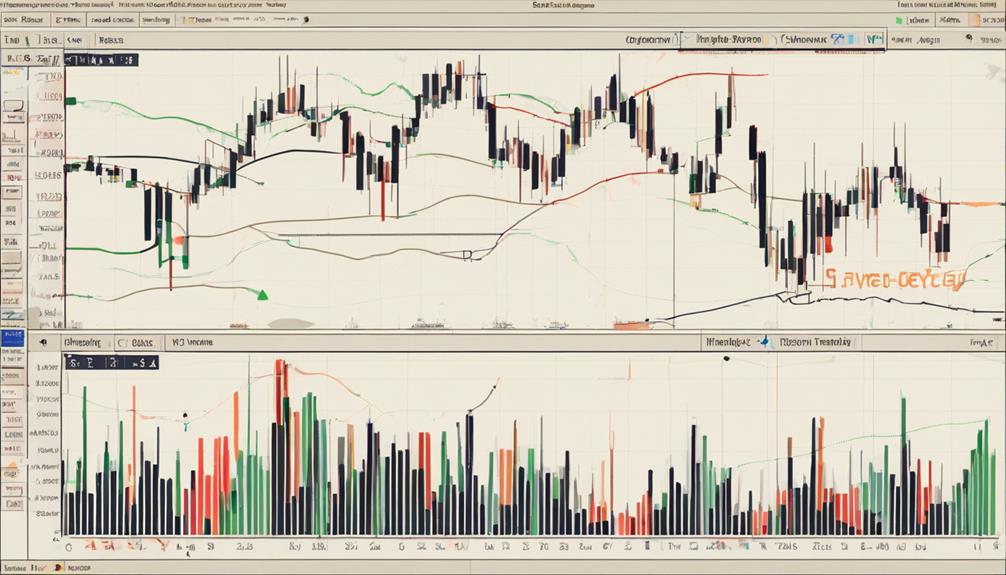
Understanding the basics of Bollinger Bands lays a strong foundation for mastering their application in day trading strategies. Bollinger Bands, comprising a middle band (20-day SMA) and upper/lower bands indicating 2 standard deviations, serve as a valuable tool for traders.
These bands expand and contract with market volatility, aiding in the identification of overbought or oversold conditions and potential trend shifts. The middle band acts as a trend indicator, while the upper and lower bands function as dynamic support and resistance levels.
Additionally, Bollinger Bands offer insights into market volatility through the Band Width measurement. By comprehending these fundamental aspects, traders can effectively leverage Bollinger Bands to enhance their day trading performance.
Calculating Bollinger Bands
To calculate Bollinger Bands effectively, start by using a 20-day Simple Moving Average (SMA) as the middle band. The upper band is derived by adding 2 times the standard deviation to the SMA, while the lower band is calculated by subtracting 2 times the standard deviation from the SMA. Understanding this formula is crucial for interpreting market conditions accurately as Bollinger Bands adjust dynamically to market volatility.
- Bollinger Bands are calculated using a 20-day Simple Moving Average (SMA) as the middle band.
- The upper band is derived by adding 2 times the standard deviation to the SMA.
- The lower band is calculated by subtracting 2 times the standard deviation from the SMA.
Interpreting Bollinger Bands for Trading
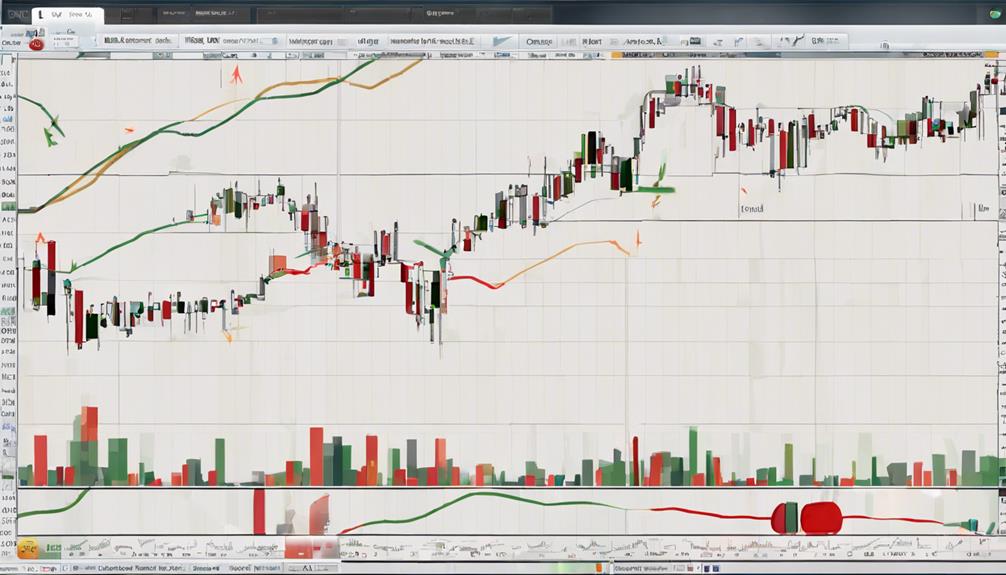
When interpreting Bollinger Bands for trading, observe how the bands adjust based on market volatility to gauge potential price movements. The width of the bands reflects market volatility, with wider bands indicating higher volatility and narrow bands suggesting lower volatility.
Touching the upper band may suggest overbought conditions, while falling below the lower band may indicate oversold conditions. Bollinger Squeeze often precedes significant price movements, while Bollinger Breakout occurs when prices breach the upper or lower bands.
Understanding these dynamics helps traders identify overbought/oversold conditions, trade trends based on band positions, and recognize market conditions when prices break outside the bands. Incorporating these interpretations into your trading strategies can enhance your day trading effectiveness.
Effective Bollinger Bands Strategies
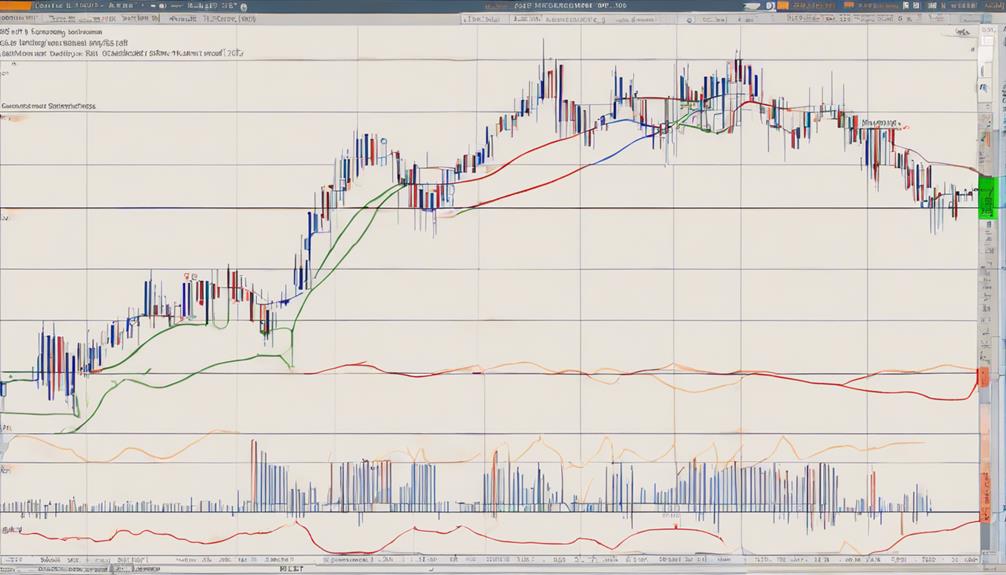
To effectively implement Bollinger Bands strategies in day trading, traders must capitalize on key signals such as Bollinger Bands Squeeze, Breakout trading, %B Indicator, RSI Divergence, and prudent risk management techniques.
Utilize Bollinger Bands Squeeze for spotting low volatility and potential breakouts.
Implement Bollinger Bands Breakout trading to confirm trend continuation.
Use Bollinger Bands %B Indicator for quantifying price relative to the bands for buy/sell signals.
What are the key strategies for mastering the use of Bollinger Bands for successful day trading?
When it comes to mastering Bollinger Bands day trading, the key strategies lie in understanding the volatility and trend of the market. Traders should use the bands as dynamic support and resistance levels, while also paying close attention to price movements and volume to make successful trading decisions.
Can Bollinger Bands Really Lead to Successful Day Trading?
When it comes to mastering Bollinger Bands for traders, many believe they can indeed lead to successful day trading. By studying the volatility and price movements, traders can make informed decisions on when to buy or sell. Proper implementation and understanding of Bollinger Bands can be a powerful tool in day trading strategies.
Advanced Techniques With Bollinger Bands
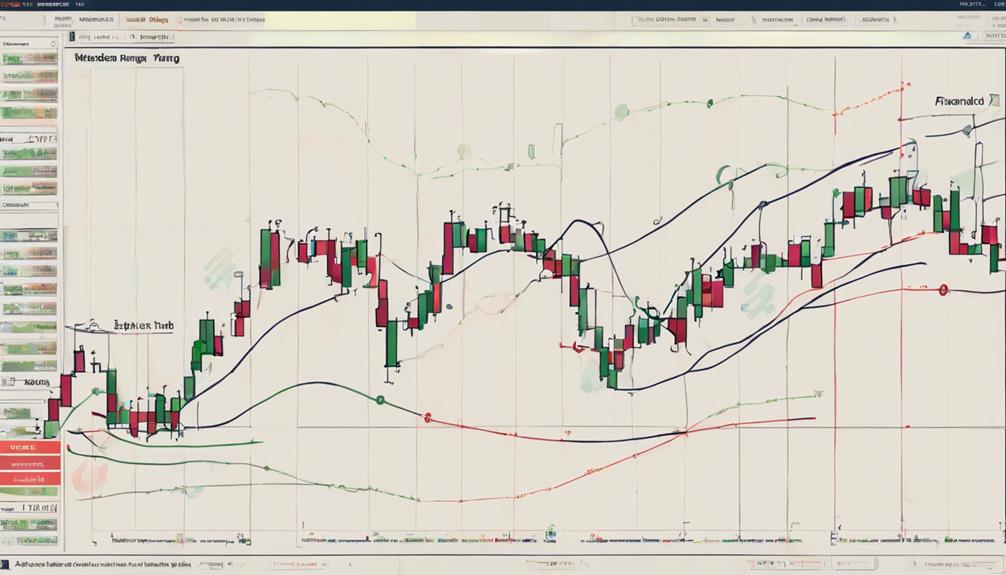
Implementing advanced techniques with Bollinger Bands requires a strategic fusion of technical analysis, risk management, and market insights to enhance trading precision and decision-making.
Utilize the Bollinger Bands %B Indicator for precise entry and exit points, crossing above 0.8 for buying and below 0.2 for selling.
Combine Bollinger Bands with RSI Divergence to spot potential trend reversals by taking positions contrary to prevailing trends.
Incorporate chart patterns and additional indicators for validation when using advanced techniques.
Employ the Bollinger Bands Breakout strategy to trade above or below the bands, capturing strong trends early.
Manage risk by setting stop-loss orders below the lower band for long positions and adjusting position sizes based on entry and stop-loss levels for optimal position sizing.
Frequently Asked Questions
What Is the Best Bollinger Band Setting for Day Trading?
For successful day trading, use a 20-period Simple Moving Average with 2 standard deviations on a 60-minute chart. This setting balances sensitivity and reliability, capturing short-term price fluctuations while filtering out noise. It aids in quick trading decisions.
How Long Should Bollinger Band Be for Day Trading?
When day trading, the length of Bollinger Bands should align with your time frame and strategy. Shorter bands like 5 or 10 for sensitive signals, longer bands like 50 or 100 for trends. Customize for accuracy and success.
How Do You Master Bollinger Bands?
To master Bollinger Bands, analyze market volatility through band width, use Middle Band as a pivot, and identify patterns like squeezes. Apply risk management by setting stop-loss orders and adjusting position sizes strategically for successful day trading.
Is Bollinger Bands a Good Indicator for Intraday Trading?
Bollinger Bands serve as a valuable tool in intraday trading, aiding in identifying price volatility and potential entry/exit points. When combined with other indicators for confirmation, they help you gauge market conditions efficiently.
Conclusion
Congratulations, you've mastered Bollinger Bands for successful day trading! Now you can confidently navigate the volatile markets with precision and skill.
Remember, Bollinger Bands are just one tool in your trading arsenal, so continue to refine your strategies and explore new techniques.
Stay vigilant, adapt to changing trends, and always keep an eye on the data.
Happy trading!