
The effective utilization of the OBV indicator is a critical component for traders navigating the complexities of the financial markets. Understanding how to interpret and apply this indicator can significantly enhance one's ability to make informed trading decisions.
By exploring the seven essential tips for maximizing the potential of the OBV indicator, traders can gain valuable insights into market dynamics and potentially improve their trading performance. Mastering these tips could be the key to unlocking new opportunities and staying ahead of market trends.
Understanding OBV Indicator Basics
The foundation of effective utilization of the OBV indicator lies in comprehending its fundamental principles and operational mechanics. OBV, or On-Balance Volume, is a technical analysis indicator that uses volume flow to predict price trends.
By adding volume on up days and subtracting volume on down days, OBV provides insight into market sentiment and potential price movements. Investors use OBV to confirm trends, identify potential reversals, and assess the strength of a market trend.
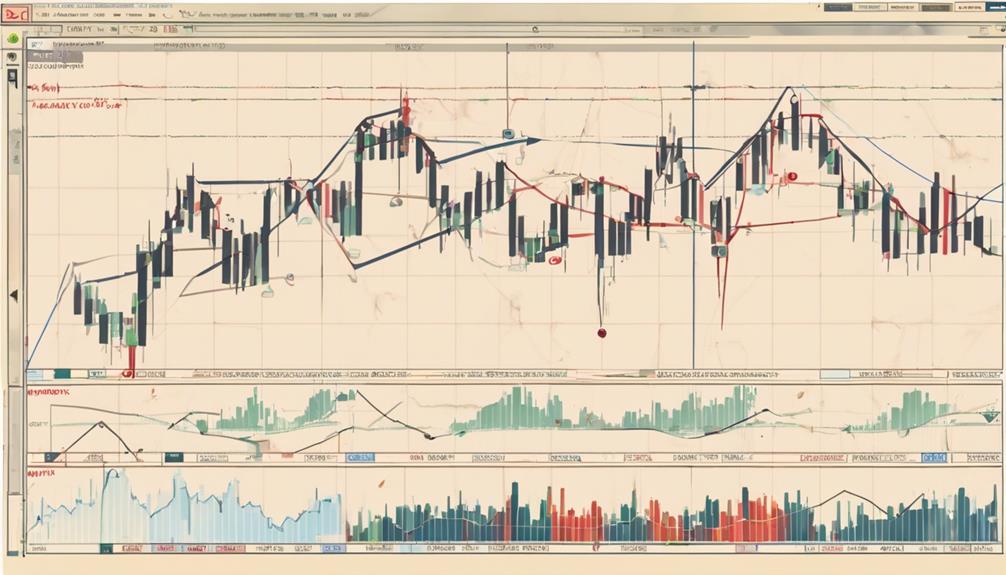
Displayed as a blue line on a chart, the OBV line is a visual representation that aids traders in making informed decisions based on volume and price movements. Understanding the basics of OBV is crucial for interpreting the signals it generates, as these signals can provide valuable information for traders looking to capitalize on market opportunities.
Selecting the Right Timeframe
Selecting an appropriate timeframe is essential for optimizing the effectiveness of the OBV indicator in aligning with your trading strategy and objectives. When engaging in volume trading, the timeframe chosen significantly impacts the quality of OBV signals received.
For those involved in intraday trading, opting for shorter timeframes like M5 to M30 can enhance OBV accuracy, providing more timely insights for quick decision-making. Conversely, swing traders may find longer timeframes such as H1 or daily more suitable, as these intervals offer more reliable OBV signals conducive to swing trading strategies.
It is crucial to match the timeframe with your specific trading style and goals to ensure the OBV indicator complements your approach effectively. While shorter timeframes may yield more frequent signals, traders should be cautious as these signals could be less reliable.
On the other hand, longer timeframes help filter out noise and provide robust trend confirmation, leading to more reliable signals for making informed trading decisions.
Identifying OBV Divergences
To effectively identify OBV divergences, traders must keenly observe instances where the indicator moves contrary to the price movement, signaling potential trend shifts and trading opportunities. OBV divergences, whether bullish or bearish, provide valuable insights into potential trend reversals.
A bullish divergence occurs when the OBV rises while the price falls, suggesting a possible upward price movement in the future. On the other hand, a bearish divergence is observed when the OBV falls as the price rises, indicating a potential downward price correction.
Using OBV for Trend Confirmation
Utilizing OBV for trend confirmation involves analyzing the correlation between OBV trends and price movements to validate the strength of market trends.
By assessing OBV volume changes alongside price action, traders can gain deeper insights into market sentiment and potential trend reversals.
Integrating OBV with other technical indicators can enhance the accuracy of trend confirmation and assist traders in making well-informed decisions.
OBV Trend Analysis
Analyzing price movements in conjunction with volume changes through OBV trend analysis provides valuable insights into the strength and direction of trends in the market. OBV trend confirmation helps identify stable trends, potential trend reversals, and overbought conditions.
Divergences in OBV can signal upcoming price reversals or trend continuations, aiding in decision-making processes. By understanding OBV trends, traders gain a better grasp of market sentiment and can adjust their trading strategies accordingly.
Utilizing OBV for trend confirmation enhances overall trading strategies by providing a clearer picture of the market dynamics, thus improving the effectiveness of trades and risk management strategies.
OBV Volume Correlation
Enhancing trading strategies through the correlation of volume with price movements using On-Balance Volume (OBV) provides a robust method for confirming trends and identifying trend reversals.
OBV volume correlation helps confirm trend strength by assessing the relationship between volume and price movements, indicating the intensity of buying or selling pressure within a trend. This tool also validates trend sustainability by demonstrating consistent volume support.
Incorporating OBV Into Breakout Strategies
Incorporating the On-Balance Volume (OBV) indicator into breakout strategies involves a detailed examination of volume surges that occur during breakout movements. By observing increasing volume alongside price movement, traders can use OBV to confirm the strength of a breakout. This approach helps filter out false breakouts, allowing traders to focus on high-probability buying or selling opportunities.
Monitoring OBV during breakouts also provides valuable insights into the sustainability of the new trend, aiding in decision-making processes. Furthermore, combining OBV with breakout patterns enhances the accuracy of trading decisions, particularly in volatile market conditions. This integration enables traders to make more informed choices by leveraging the signals provided by OBV in conjunction with breakout signals.
Combining OBV With Other Indicators
The integration of OBV with various indicators serves to enhance signal confirmation and provide a more comprehensive analysis of market conditions.
By combining OBV with moving averages, RSI, MACD, Bollinger Bands, or Fibonacci retracement levels, traders can gain valuable insights into trend strength, potential reversals, volatility changes, and key support/resistance levels.
These interactions between OBV and other indicators offer a multi-dimensional approach to technical analysis, improving the accuracy of trading decisions.
Indicator Interactions
Effectively combining the On-Balance Volume (OBV) indicator with other technical indicators can significantly enhance trend analysis and trading signals. When integrating OBV with different indicators, various aspects of market behavior can be better understood.
Here are some key interactions to consider:
- OBV with Moving Averages: Helps confirm trends and determine entry/exit points.
- OBV with RSI: Enhances trend confirmation and identifies overbought/oversold conditions.
- OBV with MACD: Improves detection of divergences and analysis of trend strength.
- OBV with Bollinger Bands: Assists in spotting volatility-based trading opportunities.
Signal Confirmation
To enhance the accuracy of trend analysis and trading signals, it is advantageous to combine the On-Balance Volume (OBV) indicator with other technical indicators for signal confirmation. Integrating OBV with moving averages can help validate signals, while utilizing OBV in conjunction with trend lines or support/resistance levels can further strengthen signal confirmation.
Cross-referencing OBV signals with indicators like RSI or MACD provides additional validation for trading decisions. Additionally, incorporating OBV with Fibonacci retracement levels offers comprehensive confirmation of potential price movements.
Seeking consistent alignment between OBV signals and other technical indicators can significantly increase confidence in trade setups, leading to more informed and strategic trading decisions.
Monitoring OBV for Market Sentiment
How can monitoring OBV enhance understanding of market sentiment dynamics? OBV, or On-Balance Volume, is a powerful tool that provides valuable insights into market sentiment by analyzing volume changes. By paying close attention to OBV, traders can gain a better understanding of the underlying buying and selling pressure in the market.
Here are some key aspects to consider when monitoring OBV for market sentiment:
- Identifying Trends: OBV helps traders identify prevailing trends in the market based on volume adjustments.
- Spotting Reversal Opportunities: Changes in OBV can signal potential reversals in the market direction, offering traders a chance to adjust their positions accordingly.
- Understanding Smart Money Movements: OBV divergence without corresponding price changes can indicate smart money actions, providing valuable clues for traders.
- Analyzing Market Player Strategies: By tracking OBV, traders can decipher the strategies of different market players and adjust their own tactics accordingly.
What Are the Essential Tips for Using the OBV Indicator Effectively?
Maximize your trading strategy by incorporating a stepbystep OBV indicator reading. Begin by overlaying OBV with the price chart to identify trends. Focus on divergences between OBV and price for potential reversals. Combine OBV trends with volume surges for confirmation, and regularly assess OBV line slopes for momentum insights. Always cross-verify signals with other indicators to enhance accuracy.
Frequently Asked Questions
What Is the OBV Indicator Strategy?
The OBV indicator strategy is a momentum-based tool created by Joseph Granville in 1963. It tracks volume flow to gauge market sentiment, confirm trends, spot reversals, and identify overbought or oversold conditions, providing traders with valuable insights for informed decision-making.
What Is the Best Time Frame for OBV Indicator?
The best time frame for the OBV indicator varies based on the trader's strategy and goals. Day traders often opt for shorter time frames like 5-minute or 15-minute charts, while longer time frames such as weekly or monthly can be used for trend analysis.
How Do You Use a Volume Indicator Effectively?
Employing volume indicators effectively involves analyzing volume changes to validate price movements and anticipate potential reversals. By understanding market sentiment through OBV, traders can enhance trend identification and pinpoint key support/resistance levels for informed decision-making.
What Is the OBV Breakout Strategy?
The OBV Breakout Strategy is a trading approach that identifies strong breakout signals by analyzing the relationship between price movements and On-Balance Volume (OBV). Traders seek confirmation signals like a surge in OBV volume before executing trades.
Conclusion
In conclusion, mastering the effective use of the On-Balance Volume (OBV) indicator is akin to navigating the currents of the market with a skilled sailor at the helm. By understanding its basics, selecting the right timeframe, and utilizing it in tandem with other indicators, traders can harness the power of OBV to navigate market trends and make informed decisions.
Incorporating OBV into trading strategies can lead to smoother sailing in the turbulent waters of the financial markets.