
When it comes to optimizing your trading with momentum indicators, there are three key strategies that could significantly impact your success in the market. By incorporating these tips into your trading routine, you might just find yourself navigating the complexities of momentum trading with more precision and confidence.
Want to discover how you can enhance your trading skills and make informed decisions utilizing momentum indicators?
Importance of Momentum Indicators
Understanding the significance of momentum indicators is paramount for traders seeking to enhance their analytical capabilities in the dynamic world of asset trading.
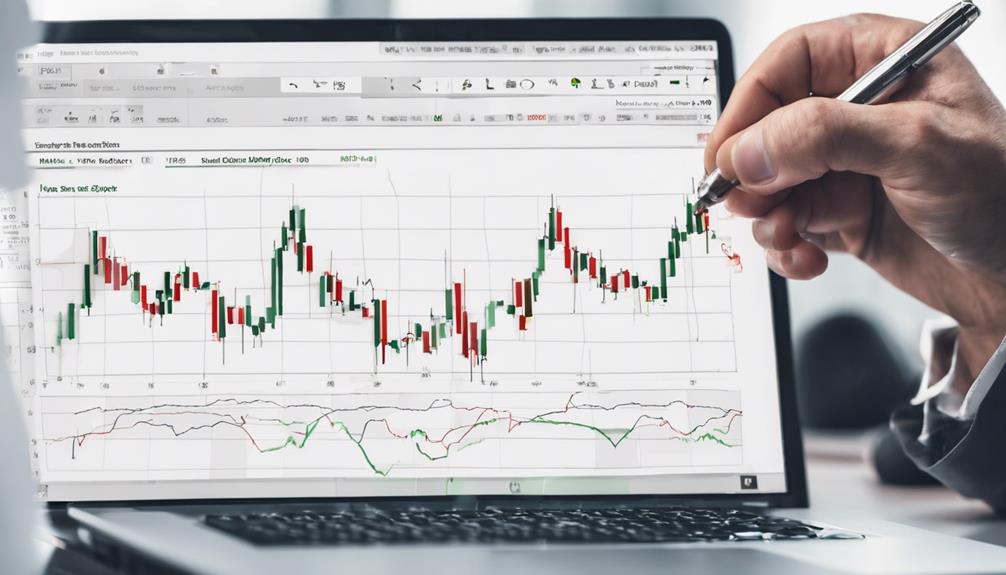
Momentum indicators, such as RSI, MACD, and Stochastic Oscillator, play a crucial role in Momentum Trading Strategies by gauging the rate of change in asset prices.
These indicators provide insights into the strength of price trends, helping traders identify potential trading signals.
By analyzing the data provided by these indicators, traders can make informed decisions regarding their positions in the market.
Incorporating momentum indicators into your trading strategy can optimize your approach and improve the accuracy of your predictions, leading to more successful trading outcomes.
Utilizing Relative Strength Index (RSI)
Incorporating the Relative Strength Index (RSI) into your trading strategy can provide valuable insights into potential overbought or oversold conditions in asset prices. When utilizing RSI, traders should consider the following:
- RSI values above 70 indicating overbought conditions and potential price reversals.
- Values below 30 on the RSI suggesting oversold conditions and potential price reversals.
- Looking for divergence between RSI and price movements can signal trend reversals.
Leveraging Moving Average Convergence Divergence (MACD)
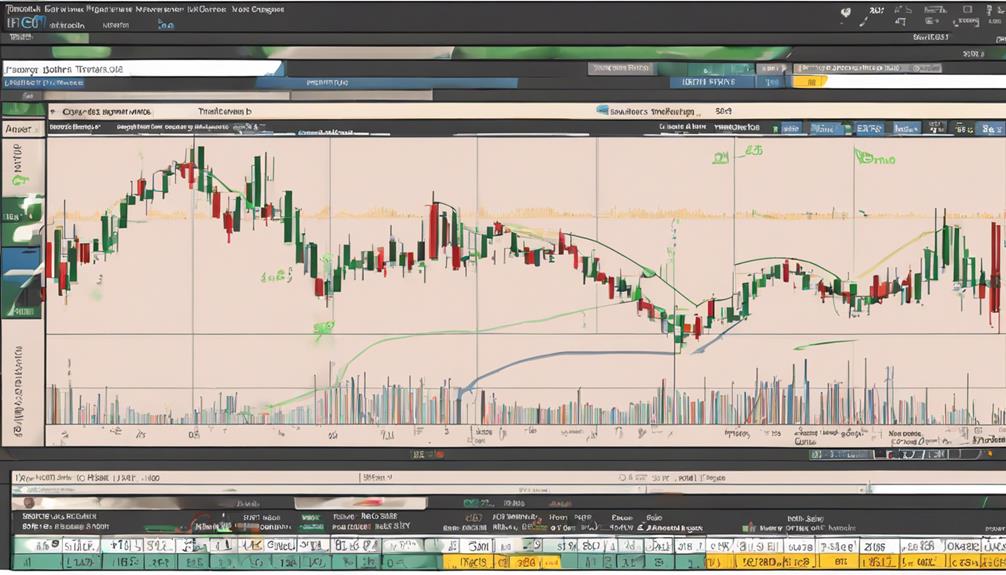
To optimize your trading strategy, leverage the Moving Average Convergence Divergence (MACD) indicator, a popular tool that combines moving averages to identify potential trend changes. The MACD consists of two lines: the MACD line and the Signal line, where crossovers signal buying or selling opportunities. Look for bullish signals when the MACD line crosses above the Signal line, and bearish signals when it crosses below.
The MACD histogram, derived from these lines, visually represents the difference between them, aiding in confirming trend strength. By understanding how to interpret the MACD and integrating it with other indicators, you can enhance your trading decisions and optimize your momentum trading strategies effectively.
Implementing Stochastic Oscillator

To further fortify your trading strategy with momentum indicators post exploring the Moving Average Convergence Divergence (MACD), consider implementing the Stochastic Oscillator, a tool that gauges price momentum by analyzing the relation between closing prices and a specified price range over time.
The Stochastic Oscillator can be beneficial due to its ability to identify potential trend reversals and confirm existing trends effectively.
Here are three key points to consider when using the Stochastic Oscillator:
- Utilize the overbought and oversold levels (above 80 and below 20, respectively) to pinpoint potential reversal points.
- Pay attention to the %K and %D lines for trading signals.
- Enhance the accuracy of your trades by combining the Stochastic Oscillator with other momentum indicators.
Enhancing Entry and Exit Points
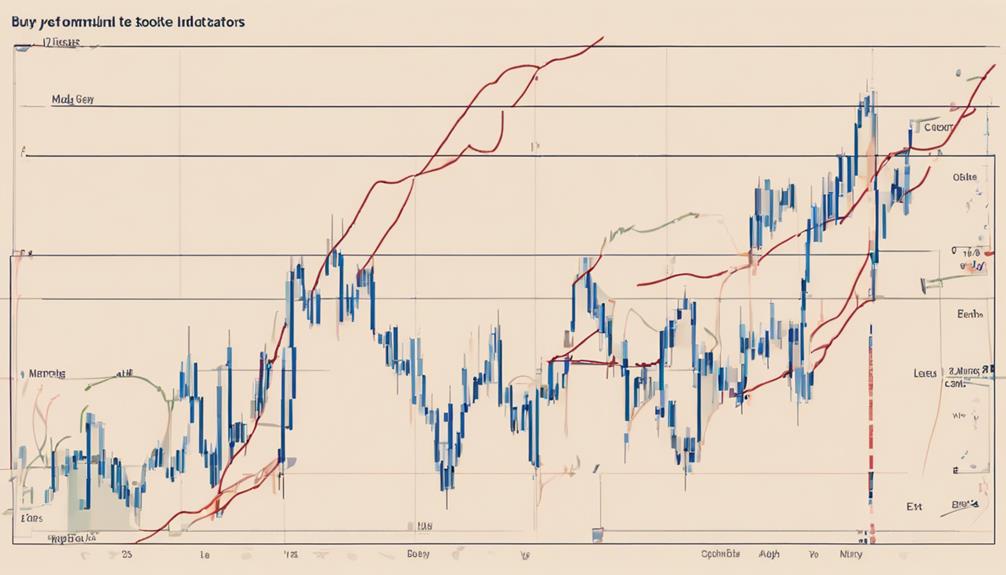
Enhance your trading strategy's effectiveness by strategically utilizing momentum indicators like RSI, MACD, or the Stochastic Oscillator to identify precise entry and exit points for your trades. Combining these indicators with other technical analysis tools can help confirm signals and improve trading accuracy.
By setting specific price levels or indicator values as triggers for entry and exit, you can avoid emotional decision-making and stick to your plan. Utilize historical price data alongside momentum indicators to validate signals and enhance trade execution.
It's crucial to regularly review and adjust your trading strategy based on how well momentum indicators optimize your entry and exit points. Stay disciplined and let data guide your decisions for successful trading outcomes.
What are the best tips for using momentum indicators in stock trading?
When using momentum indicators in stock trading, it’s crucial to look for divergences between price and momentum to anticipate potential trend reversals. Additionally, it’s important to use multiple momentum indicators to support each other’s signals and confirm trading decisions. Mastering momentum indicators stock trading takes time and practice.
Frequently Asked Questions
How Do You Trade With Momentum Indicator?
To trade with momentum indicators, you analyze price trends for potential reversals based on overbought/oversold conditions. Set signal levels and use lookback periods for sensitivity. Implement strategies like crossovers and divergence trading while being wary of false signals.
What Are the Three Momentum Indicators?
When trading with momentum indicators, three crucial tools are the Relative Strength Index (RSI), Moving Average Convergence Divergence (MACD), and Stochastic Oscillator. These indicators gauge price movement speed, signal momentum shifts, and help identify optimal entry and exit points.
What Are Momentum Trading Strategies?
To trade with momentum, focus on buying assets with upward momentum and short-selling those with downward trends. Utilize indicators like trend lines, moving averages, and Stochastic analysis for successful strategy implementation in short-term trading.
What Are the Keys to Momentum Trading?
To succeed in momentum trading, confirm trades with various factors. Analyze sector sentiment, news, and indicators like RSI. Set Stop Loss and Take Profit levels wisely. Stay calm and adapt strategies actively for market changes.
Conclusion
Incorporating momentum indicators into your trading strategy is like navigating a ship through turbulent waters with a reliable compass. By utilizing tools like RSI, MACD, and Stochastic Oscillator, you can steer your trades towards success with precision and confidence.
Remember to set your course with calculated entry and exit points, and you'll be well on your way to optimizing your trading with momentum indicators.
Safe sailing and profitable trading ahead!