
The practical application of the ADX trading indicator is essential for traders seeking to navigate volatile markets with precision and confidence.
By mastering the intricacies of ADX, traders can gain valuable insights into trend strength and potential market reversals, ultimately leading to more informed trading decisions.
However, while understanding the basics is crucial, the true efficacy of the ADX indicator lies in its strategic implementation within a comprehensive trading framework.
Unraveling the nuances of this powerful tool and harnessing its full potential can significantly elevate one's trading prowess and outcomes in the dynamic world of financial markets.
Understanding ADX Trading Indicator
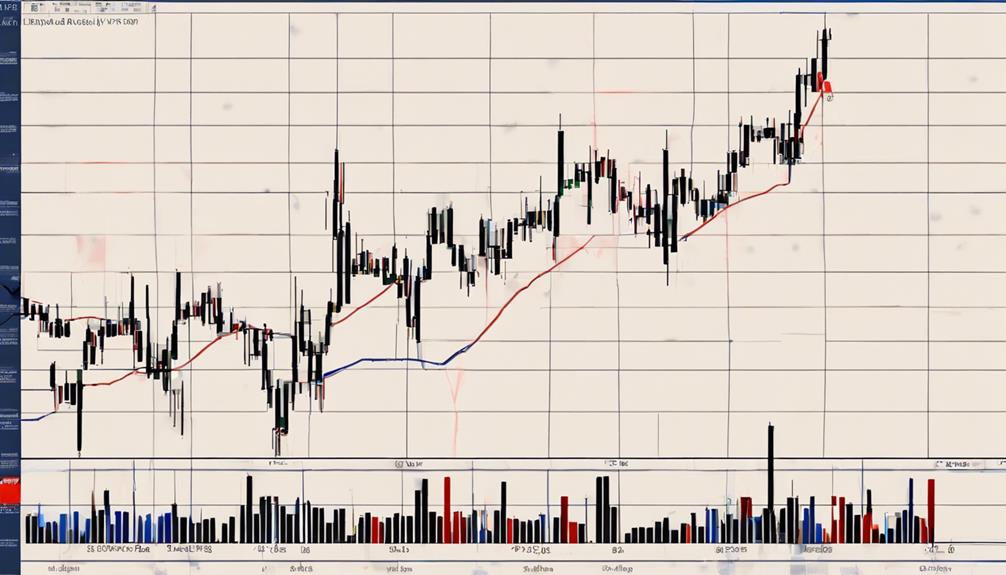
The ADX trading indicator, a key tool for technical analysis, provides traders with a quantitative measure of trend strength devoid of directional bias. Consisting of three components – the ADX line, +DI line, and -DI line, the indicator aids in assessing the strength of a market trend.
By focusing on trend strength rather than direction, the ADX helps traders identify the momentum behind price movements. ADX values above 25 typically indicate a strong trend, making it suitable for trend-trading strategies. Traders often look for rising ADX values as they can signal potential trend changes or reversals in the market.
Moreover, the ADX is essential for determining whether a price breakout is likely to result in a sustained trend. Understanding the ADX indicator is crucial for traders seeking to navigate market trends effectively, as it offers valuable insights into the underlying strength of price movements.
ADX Calculation and Interpretation
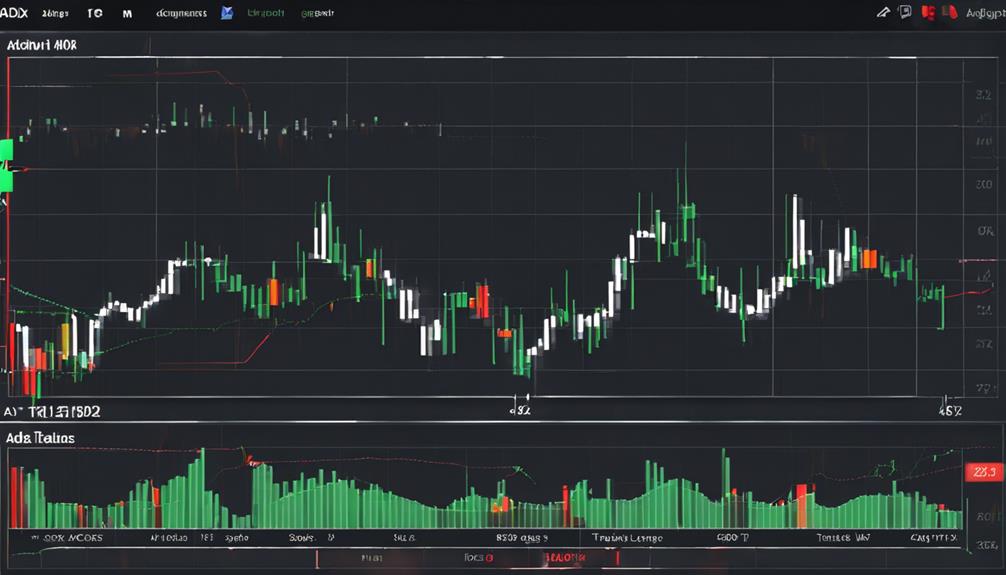
Quantifying trend strength through averaging Directional Movement Index (DMI) values over a specified period is the fundamental calculation involved in determining the ADX indicator. This averaging process, typically done over 14 bars, results in the ADX line, which is used to assess the strength of a trend. Values above 25 on the ADX line suggest a strong trend, while values below 20 indicate a weaker trend.
When interpreting the ADX indicator, traders pay close attention to crossovers between the Positive Directional Indicator (+DI) and Negative Directional Indicator (-DI) lines, as these can signal potential trend changes. A rising ADX may indicate increasing trend strength or momentum, while a declining ADX could suggest trend weakening or possible reversals.
Ultimately, the ADX helps traders objectively assess trend strength, providing valuable insights for making informed trading decisions based on trend assessment.
Applying ADX in Trading Strategies
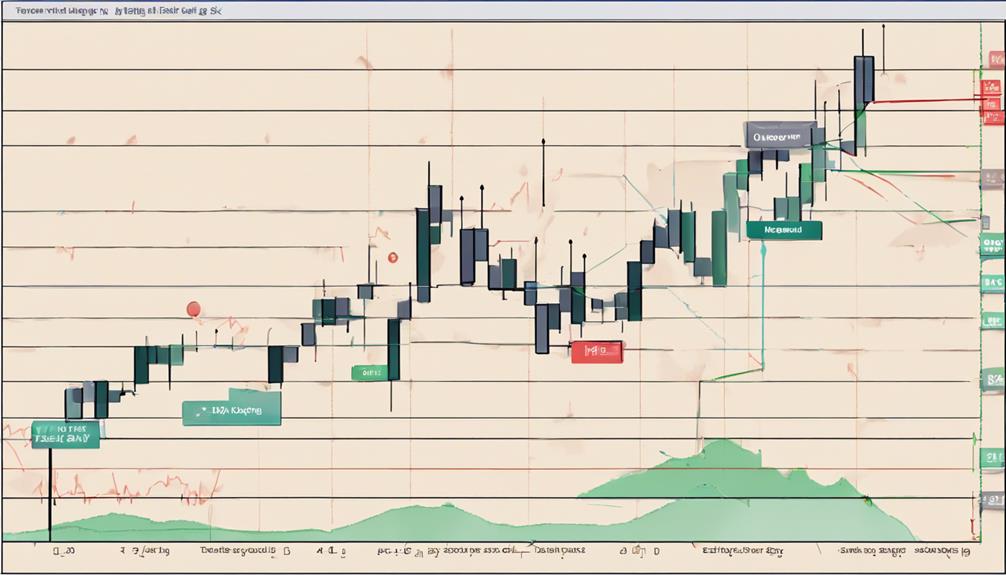
When implementing ADX in trading strategies, it is essential to consider its role in identifying trend strength and potential entry or exit points. Traders can effectively use the ADX indicator in their trading approach by following these strategies:
- Trend Identification: Utilize ADX values above 25 to identify trending conditions, indicating a strong trend suitable for trend-trading strategies.
- ADX Crossovers: Pay attention to the +DI and -DI line crosses, as they can signal potential trend changes, providing entry or exit points for trades.
- Filtering Ranges: Wait for the ADX to rise above 25 to avoid range-bound markets, focusing on trading opportunities with stronger trends.
- Combination with Indicators: Enhance trend confirmation by combining ADX with other technical indicators like moving averages, boosting the accuracy of trade decisions.
Enhancing ADX Indicator Accuracy
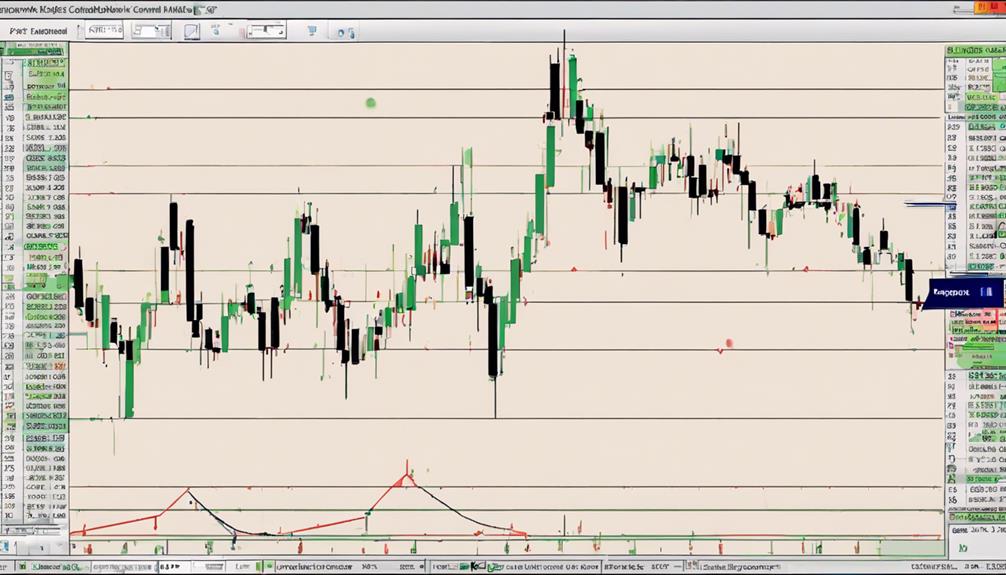
To optimize the effectiveness of the ADX indicator in trading strategies, meticulous adjustments tailored to specific market conditions and timeframes are imperative. Fine-tuning the ADX settings based on the expected market movement and trend duration can significantly enhance the accuracy of the indicator.
Combining ADX with other technical indicators such as moving averages can provide a more comprehensive view of trend strength and direction. Backtesting different ADX configurations regularly is crucial to ensure consistent performance and reliability over time.
Considering various ADX periods can help capture different trend durations effectively, enabling traders to adapt to changing market conditions. Implementing filters or additional criteria to validate ADX signals can further enhance the accuracy of trading decisions, providing a more robust foundation for successful trades.
Practical Tips for ADX Implementation
Implementing the ADX indicator effectively in trading strategies requires a strategic approach that leverages concrete market insights and technical analysis. To enhance trend identification and make informed trading decisions, consider the following practical tips:
- Utilize ADX Values: Use ADX values above 25 to confirm strong trends suitable for trend-trading strategies, while ADX below 25 indicates weak trends, signaling caution in trend-based trading.
- Monitor ADX Peaks: Look for ADX peaks to assess trend momentum, with higher peaks indicating stronger momentum that may present trading opportunities.
- Identify Potential Trend Changes: ADX can help identify potential trend changes through momentum divergence signals, offering insights into when trends might be losing strength or reversing.
- Combine with Price Analysis: Combine price analysis with ADX readings for a comprehensive view, enhancing trend identification accuracy and aiding in making well-informed trading choices.
How Can I Use the Practical Approach to ADX Trading Indicator to Improve My Trading Strategy?
When considering your trading strategy, it’s important to understand why use ADX indicator. By incorporating the practical approach to ADX trading, you can gain insight into the strength of a trend. This can help you make more informed decisions and improve the overall effectiveness of your trading strategy.
How Can I Use the ADX Trading Indicator Effectively as a Trader?
As a trader, utilizing the top ADX indicator for traders can be highly effective. By analyzing the strength of a trend, identifying potential changes in market direction, and confirming entry and exit points, this powerful tool can help you make informed trading decisions and improve your overall trading strategy.
Frequently Asked Questions
What Is the Best Way to Use ADX Indicator?
In trading, the optimal utilization of the ADX indicator involves identifying trend strength through values above 25 for trend-trading strategies. Combining ADX with +DI and -DI lines can enhance trend direction and strength analysis, aiding in decision-making processes.
What Is the Best Time Frame for ADX Indicator?
Determining the optimal time frame for the ADX indicator involves balancing signal frequency and responsiveness. Traders can customize settings to align with their strategy, with shorter time frames offering more signals and longer ones providing smoother but delayed readings.
What Is the Secret of the ADX Indicator?
The secret of the ADX indicator lies in its unique ability to quantify trend strength independently of direction. Traders leverage ADX to distinguish strong trends (above 25) from weak trends (below 20) and gauge market sentiment through +DI and -DI lines.
What Is the ADX Press Strategy?
The ADX Press strategy is a method that leverages ADX readings above 25 to identify strong trends. It involves entering trades upon confirmation of a trending market with substantial momentum, aiming to ride the trend until signs of weakening appear.
Conclusion
In conclusion, the practical approach to using the ADX trading indicator involves understanding its components, interpreting values, and integrating it with other indicators for effective trend analysis.
By identifying trend strength and utilizing trend-following strategies, traders can make informed decisions on market entry and exit points.
Implementing buy and sell signals based on ADX crossovers and managing risk through trend momentum alerts are essential for successful trading.