
In the fast-paced world of cryptocurrency trading, having a strategic approach is paramount. Understanding the nuances of volatility indicators can make or break a trader's success. As the market continues to evolve, the reliance on tried-and-tested indicators becomes increasingly crucial.
The 10 best volatility indicators offer a comprehensive toolkit for traders seeking to navigate the unpredictable nature of cryptocurrencies. By incorporating these indicators into their analytical arsenal, traders can gain a competitive edge and make informed decisions in an ever-changing landscape.
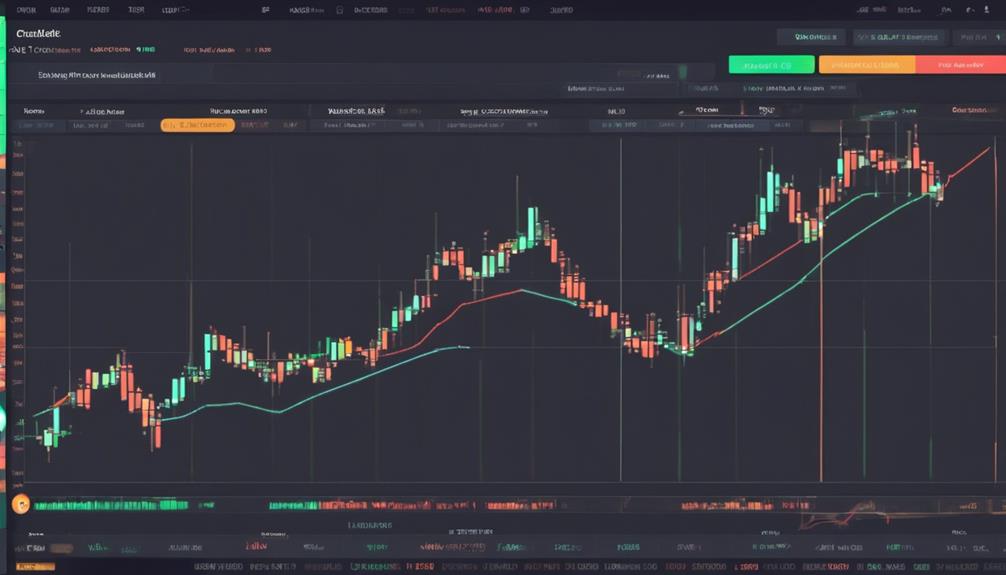
Bollinger Bands
Bollinger Bands, a popular technical analysis tool in cryptocurrency trading, combine a simple moving average with two standard deviations to assess market volatility and define potential support and resistance levels. These bands are dynamic in nature, expanding during periods of higher volatility and contracting when the market is calmer. This feature aids traders in identifying overbought or oversold conditions, where prices may be due for a reversal. Additionally, Bollinger Bands are widely utilized for spotting potential price breakouts, offering entry and exit points for traders.
When used in isolation, Bollinger Bands provide valuable insights into market conditions; however, combining them with other technical indicators can enhance their effectiveness. Traders often integrate Bollinger Bands with tools like Relative Strength Index (RSI) or Moving Average Convergence Divergence (MACD) for a more comprehensive analysis. While Bollinger Bands excel in capturing volatility and determining key price levels, traders should be mindful that these indicators may not perform optimally in bear markets where prices exhibit different characteristics.
Average True Range (ATR)
In the realm of cryptocurrency trading, the Average True Range (ATR) serves as a vital volatility indicator positioned at the bottom of the chart, offering insights into market volatility dynamics.
ATR calculates volatility by comparing the current price range with its historical range, with higher ATR values signaling increased market volatility. This indicator is particularly useful for traders as it helps in identifying potential trend beginnings in cryptocurrency trading.
By utilizing ATR, traders can effectively set stop-loss levels and adjust their trading strategies based on the changing market volatility conditions. The ATR line on the chart provides a clear visual representation of how volatile the market is, enabling traders to make informed decisions regarding their positions.
Understanding the ATR values can assist traders in managing risk and optimizing their trading approach to align with the prevailing market conditions efficiently.
Parabolic SAR Indicator
The Parabolic SAR indicator utilizes a specific calculation method to track potential reversal points in an asset's price movement. Traders often apply this indicator to establish effective stop-loss levels and identify optimal entry and exit points in the market.
SAR Calculation Method
Utilizing a calculated approach based on current and previous extreme prices, the Parabolic SAR indicator assists traders in pinpointing strategic stop and reverse points in cryptocurrency trading.
- The Parabolic SAR indicator calculates stop and reverse points by plotting dots above or below the price chart.
- It helps traders identify potential trend reversals or continuation points in the market.
- The SAR calculation method is based on the current and previous extreme prices.
- The indicator is visualized as a series of dots that move with price action, providing dynamic stop-loss levels.
Traders use the Parabolic SAR to set trailing stop-loss orders and manage risk effectively.
SAR Indicator Application
By closely tracking price movements, the Parabolic SAR indicator offers traders a dynamic tool for identifying potential reversal points in volatile cryptocurrency markets. Known as the Stop and Reverse indicator, Parabolic SAR provides traders with trailing stop-loss levels to protect profits amidst rapid price changes. This tool is particularly effective in volatile markets where trends can shift swiftly.
Displayed on the chart as dots above or below the price, the Parabolic SAR signals potential trend reversals, aiding traders in making informed decisions on entry and exit points based on evolving market conditions. Overall, the Parabolic SAR indicator is a valuable asset for cryptocurrency traders seeking to navigate the unpredictable nature of the market with more precision and confidence.
Cryptocurrency Volatility Index
Providing essential insights into market dynamics, the Cryptocurrency Volatility Index (CVI) is a powerful tool for predicting price fluctuations and managing risk in volatile cryptocurrency trading environments. The CVI offers traders a unique perspective on market volatility, assisting in making informed decisions and optimizing trading strategies.
Here are some key points to consider about the Cryptocurrency Volatility Index:
- CVI helps traders anticipate changes in price action by analyzing historical volatility trends.
- It provides valuable insights into the level of risk associated with different cryptocurrencies.
- Utilizing CVI-based tools can aid investors in predicting near-future price movements.
- The index is instrumental in assessing market conditions and implementing effective risk management strategies.
Keltner Channel Indicator
The Keltner Channel indicator is a blend of an exponential moving average and average true range. It is pivotal in recognizing potential price breakouts. By displaying upper and lower bands based on the average true range, this tool aids in visualizing price volatility.
Its utility extends to trend identification, evaluation of overbought or oversold conditions, and the establishment of entry and exit points.
Keltner Channel Basics
A fundamental tool in technical analysis for evaluating price volatility in cryptocurrency trading is the Keltner Channel indicator. It comprises an exponential moving average and two bands derived from the average true range. The Keltner Channel basics include:
- Volatility-based technical analysis tool.
- Consists of an exponential moving average and two bands based on the average true range.
- Upper band represents overbought conditions; lower band indicates oversold conditions.
- Traders utilize it to identify potential trend reversals and trading opportunities.
The Keltner Channel helps traders assess market volatility, enabling them to establish entry and exit points based on price movements. Its clear signals for overbought and oversold conditions assist traders in making informed decisions during cryptocurrency trading.
Interpretation Tips
To effectively utilize the Keltner Channel indicator in cryptocurrency trading, understanding key interpretation tips is essential for informed decision-making based on price volatility boundaries. Traders can use this indicator to identify potential overbought and oversold conditions in the market. The upper and lower channel bands of the Keltner Channel expand and contract based on the level of price volatility, providing valuable insights into potential market conditions.
Trading Strategies With Keltner
Utilizing the Keltner Channel indicator in cryptocurrency trading necessitates employing strategic approaches that leverage price movement and volatility dynamics for identifying optimal entry and exit points. Traders can benefit from this indicator by:
- Utilizing the three lines: middle line based on an exponential moving average, upper and lower bands based on the average true range.
- Adapting to market volatility: Channels expand during high volatility and contract during low volatility periods.
- Confirming trends and spotting breakouts efficiently.
- Setting stop-loss levels effectively.
Moving Average (MA)
Moving Averages (MA) play a crucial role in analyzing trends and potential market entry/exit points for cryptocurrency traders. Traders often utilize Simple Moving Averages (SMA) for long-term analysis and Exponential Moving Averages (EMA) for short-term insights.
Key MA timeframes such as the 200, 50, and 20-period moving averages serve as important indicators for identifying trend changes and potential entry or exit positions in the market. Death and Golden Crosses, observed in the 200 and 50-period SMAs, are significant patterns that indicate potential shifts in market sentiment and are closely monitored by traders.
MA indicators offer valuable insights into market direction and can be effectively combined with other technical indicators to enhance overall analysis. It is crucial for traders to thoroughly comprehend the nuances of MA indicators to make well-informed decisions and optimize their trading strategies effectively.
MACD Indicator
The MACD indicator, renowned for its ability to measure momentum in cryptocurrency price movements, plays a pivotal role in providing traders with valuable insights into trend changes and potential buy or sell signals.
- The MACD indicator calculates the relationship between two moving averages to measure momentum in cryptocurrency price movements.
- It consists of the MACD line, signal line, and histogram, providing insights into trend changes and potential buy or sell signals.
- Positive MACD values indicate bullish momentum, while negative values suggest bearish momentum, helping traders gauge the strength and direction of price trends.
- Traders often use the MACD indicator in conjunction with other technical analysis tools to confirm signals and make informed trading decisions.
The MACD indicator is a popular and widely used momentum indicator in cryptocurrency trading due to its effectiveness in identifying trend reversals and momentum shifts. Traders rely on the MACD indicator to make well-informed decisions regarding buy or sell signals based on the momentum trends it reveals.
RSI Indicator
When analyzing trends in cryptocurrency trading, the RSI indicator serves as a crucial tool for evaluating market conditions and potential price reversals. The Relative Strength Index (RSI) is a popular technical analysis tool that ranges from 0 to 100.
Levels above 70 indicate overbought conditions, suggesting a potential reversal to the downside, while levels below 30 signify oversold conditions, hinting at a possible upward reversal. As a momentum oscillator, the RSI helps traders gauge the strength or weakness of a cryptocurrency's price movement, aiding in decision-making regarding entry and exit points.
Traders often combine the RSI with other technical indicators such as moving averages and Bollinger Bands to conduct comprehensive analysis and confirm signals. Understanding RSI levels is essential for traders seeking to make informed trading decisions in the dynamic cryptocurrency market, where price movements can be volatile and unpredictable.
Volatility-Based Social Media Indicators
Analyzing social sentiment, tracking trending hashtags, and understanding influencer engagement provide valuable insights for cryptocurrency traders looking to gauge market volatility.
Social media indicators can offer real-time data on market sentiment, potentially impacting price movements and volatility levels.
Integrating these social media indicators with traditional volatility tools can offer traders a comprehensive view for making informed trading decisions.
Social Sentiment Analysis
How can social sentiment analysis through volatility-based social media indicators enhance cryptocurrency trading strategies?
Social sentiment analysis utilizes social media data to assess market sentiment and forecast potential price movements in cryptocurrency trading. By leveraging volatility-based social media indicators, traders can gain insights into the market mood and make well-informed decisions.
Here are some ways these indicators can be beneficial:
- Provide a gauge of market sentiment.
- Help predict potential price movements.
- Complement technical analysis with additional insights.
- Utilize tools like the Fear and Greed Index to measure market emotions.
Integrating social sentiment analysis with volatility-based indicators can offer a more comprehensive understanding of market behavior, empowering traders to navigate cryptocurrency markets effectively.
Trending Hashtag Impact
Trending hashtags on social media platforms play a significant role in influencing cryptocurrency volatility. Social media indicators, such as trending hashtags, have the power to sway market sentiment and trading decisions. By monitoring these hashtags, traders can gain insights into potential price movements and market trends.
Volatility-based social media indicators allow traders to assess market sentiment and predict price changes. The popularity of specific hashtags can create either buying or selling pressure, directly impacting cryptocurrency prices. Understanding the influence of trending hashtags on social media is crucial for traders looking to anticipate and navigate cryptocurrency price fluctuations effectively.
Influencer Engagement Insights
Engaging with influencers in cryptocurrency trading can significantly influence market sentiment and price dynamics. When considering volatility indicators in crypto trading, understanding influencer engagement is crucial for making informed trading decisions. Here are some insights to consider:
- Impact on Market Sentiment: Influencers' opinions and actions can sway market sentiment, affecting price movements.
- Predictive Potential: Tracking influencers' sentiments can offer insights into potential price shifts.
- Volume and Volatility: High levels of influencer engagement often correlate with increased trading volume and market volatility.
- Informed Decisions: Recognizing the influence of influencers on the market can help traders make more informed decisions when navigating crypto volatility.
Bitcoin Dominance and Hash Rate
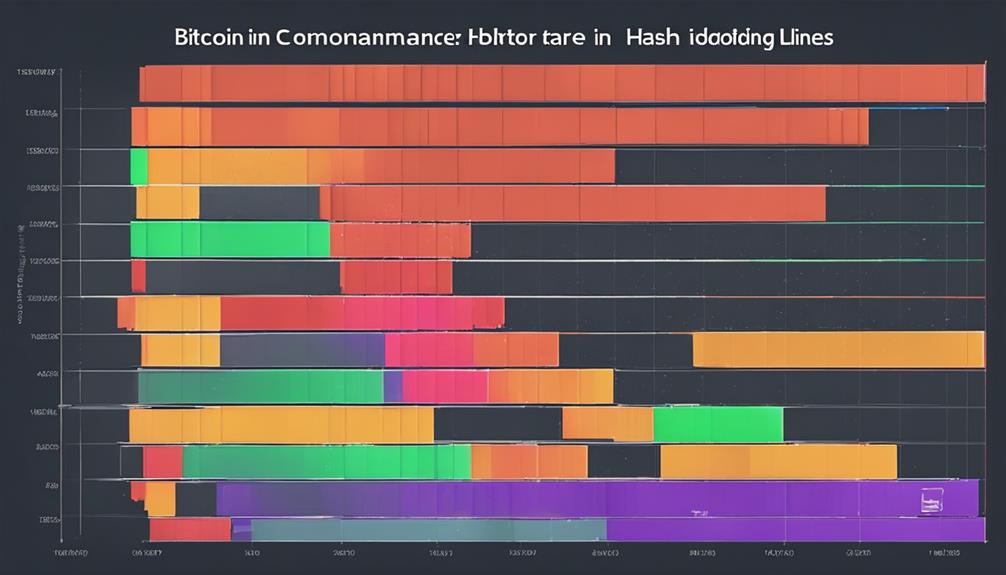
Bitcoin dominance and hash rate are critical metrics that offer valuable insights into the dynamics of the cryptocurrency market. Bitcoin dominance, representing the proportion of total market capitalization held by Bitcoin, serves as an indicator of its influence relative to other cryptocurrencies. A high Bitcoin dominance level signifies its strong market share.
On the other hand, the hash rate measures the computational power and security of the Bitcoin network, reflecting its ability to perform calculations per second. A higher hash rate indicates a more secure network and increased mining activity within the Bitcoin ecosystem.
Understanding these metrics can provide valuable information on market trends and the overall health of the cryptocurrency market. Analysts and traders often monitor Bitcoin dominance and hash rate to gauge the market sentiment and make informed decisions based on these key indicators. By incorporating these factors into their analysis, market participants can better navigate the ever-evolving cryptocurrency landscape.
How Can Volatility Indicators Help in Cryptocurrency Trading?
When trading cryptocurrency, understanding essential volatility indicators for investment is crucial. These indicators track price movements and help traders anticipate potential market swings. By utilizing volatility indicators, traders can make informed decisions, manage risk, and capitalize on profitable opportunities in the ever-changing cryptocurrency market.
Frequently Asked Questions
What Is the Most Reliable Indicator for Crypto Trading?
The most reliable indicator for crypto trading is Bollinger Bands. It utilizes a simple moving average and standard deviations to identify potential price breakouts, aiding traders in determining entry and exit points by gauging market volatility accurately.
Which Indicator Is Best for Volatility?
In assessing indicators for volatility, Bollinger Bands excel by predicting market fluctuations. The Average True Range (ATR) is effective in volatile markets for pinpointing optimal trade entry/exit points. Parabolic SAR is renowned for anticipating price reversals accurately.
Is There a Volatility Index for Crypto?
Is there a volatility index for crypto? Yes, the Cryptocurrency Volatility Index (CVI) provides insights into market fluctuations, aiding in risk management and strategic decision-making. This tool enhances understanding of historical volatility, guiding investors in asset choices.
How Do You Find High Volatility Crypto?
High volatility in cryptocurrencies can be identified through factors such as low market caps, high trading volumes, significant price fluctuations, and coins with drastic price changes. Real-time data tracking tools like Moralis Money can aid in spotting such opportunities.
Conclusion
In conclusion, incorporating a diverse range of volatility indicators is essential for successful cryptocurrency trading.
Like a skilled navigator using various tools to navigate rough seas, traders must utilize indicators such as Bollinger Bands, ATR, and Parabolic SAR to anticipate market movements and make informed decisions.
By harnessing the power of these indicators, traders can better navigate the unpredictable crypto market and increase their chances of success.