
The ROC indicator has long been recognized as a powerful tool for traders seeking to gauge momentum and make informed decisions in the market. However, mastering its intricacies and leveraging its full potential can be a nuanced endeavor.
By exploring the seven best practices associated with the ROC indicator for winning trades, traders can unlock a wealth of insights that may significantly enhance their trading performance.
From interpreting signals to managing risk and evaluating performance, each practice offers a unique perspective on maximizing the benefits of this essential tool.
ROC Indicator Basics
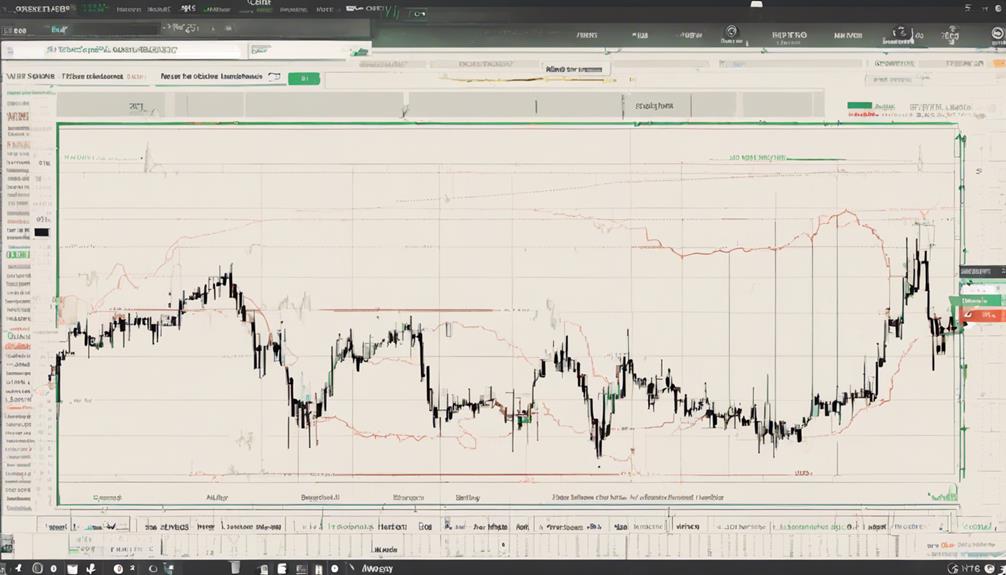
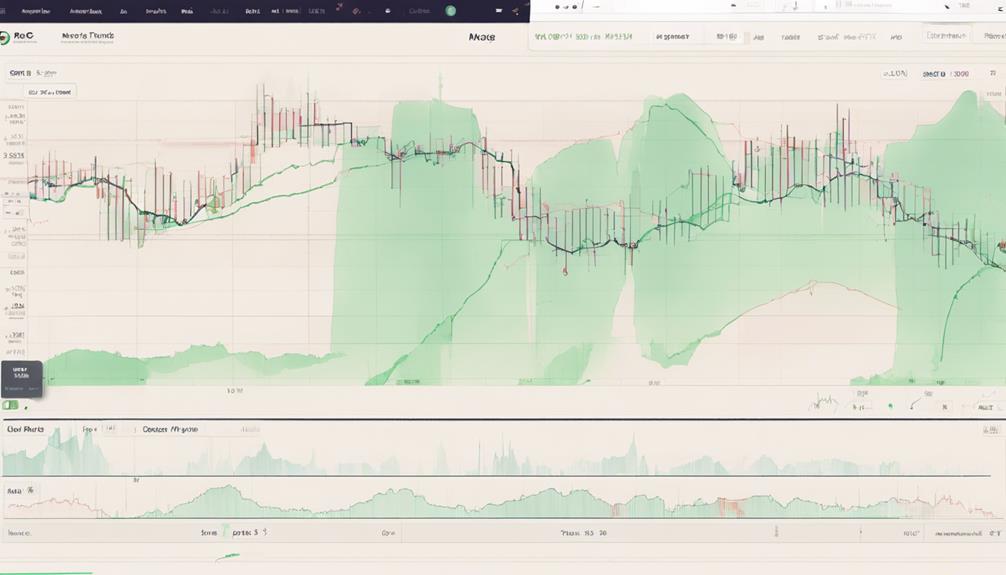
The ROC indicator, short for Rate of Change, serves as a fundamental tool in analyzing the momentum of price movements within financial markets. It calculates the percentage change in price between the current closing price and the closing price n periods ago. ROC values above zero indicate bullish momentum, while values below zero suggest bearish momentum. This indicator is typically displayed as an oscillator either above or below a zero line, with no specific overbought or oversold levels defined.
Traders utilize the ROC indicator to identify potential trend changes, overbought and oversold conditions, as well as divergences from current price action. When ROC crosses above the zero line, it can signal a shift towards bullish momentum, while a crossing below the zero line may indicate a move towards bearish momentum. Understanding these signals is crucial for traders looking to capitalize on momentum shifts in the market efficiently and effectively.
Interpreting ROC Signals
Building upon the foundation laid by understanding the basics of the ROC indicator, interpreting ROC signals is crucial for traders seeking to navigate market dynamics effectively. The Rate of Change (ROC) indicator signals bullish momentum when above zero and bearish momentum when below zero, providing insights into potential market directions.
Additionally, overbought conditions are identified by high ROC values, suggesting a possible upcoming reversal, while oversold conditions, indicated by low ROC values, may suggest buying opportunities. Zero line crossovers within the ROC can also be significant, signaling potential trend changes in the market.
Furthermore, divergences between price action and ROC can help traders identify possible trend reversals. By using ROC signals to confirm trends, breakouts, and key support/resistance levels, traders can enhance their strategies and make informed decisions based on the market's momentum and direction. Understanding these signals is essential for implementing effective trading strategies and maximizing profitability.
ROC Indicator Strategies
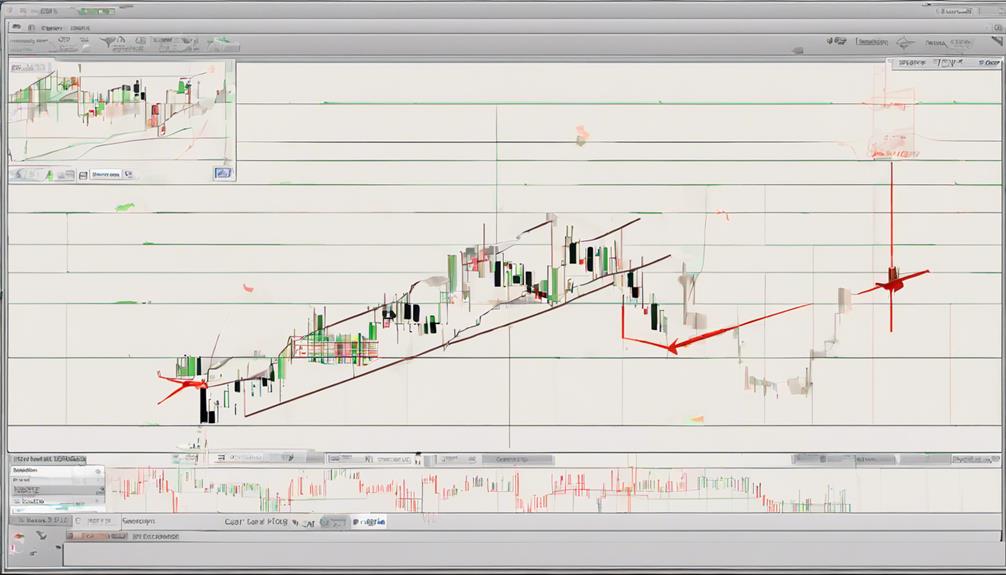
Utilizing a combination of zero-line crossovers, divergences, and trend line breakouts, traders can effectively implement ROC indicator strategies to enhance their trading decisions.
When considering ROC indicator strategies, traders often focus on the following key elements:
- Identification of Oversold/Overbought Levels: ROC can help traders identify potential entry or exit points based on extreme levels, indicating overbought conditions that may lead to a reversal or oversold conditions signaling a possible bounce back.
- Integration with Keltner Channels: Combining ROC analysis with Keltner Channels can provide traders with confirmation of price breakouts and trend directions, offering a comprehensive approach to market analysis.
- Spotting Trend Reversals: Traders can analyze divergences between price movements and ROC readings to identify potential trend reversals, allowing for timely adjustments to trading strategies in response to changing market dynamics.
These strategies enable traders to pinpoint trade entry points, determine support/resistance levels, and identify momentum shifts, although it is essential to remain cautious of false signals that may arise without complementary tools or indicators.
Combining ROC With Other Indicators
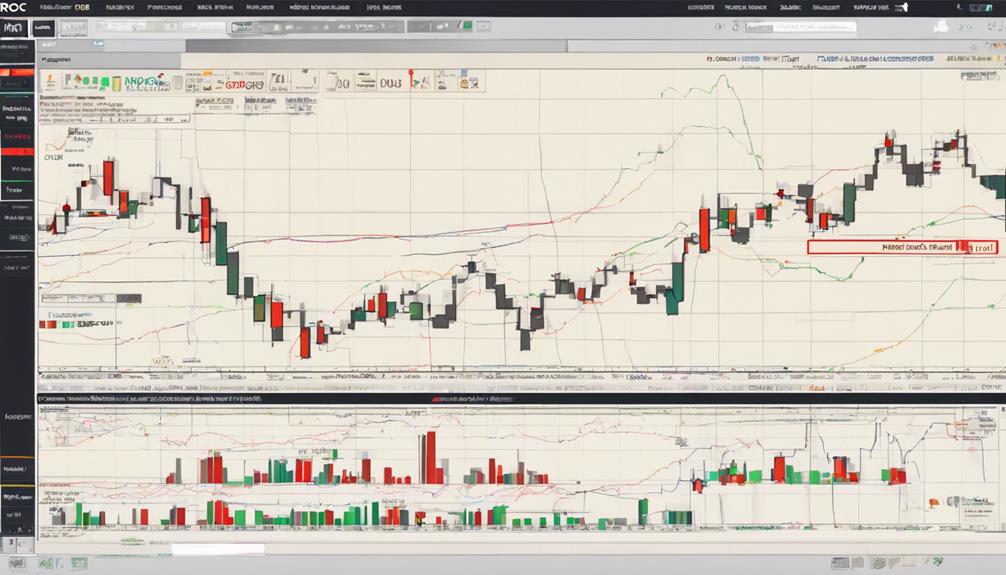
Incorporating the Relative Oscillator (ROC) with a diverse range of complementary indicators can amplify the effectiveness of trading strategies by providing comprehensive validation and confirmation signals. When combined with moving averages, ROC can confirm trend directions and enhance trading signals.
Utilizing ROC with oscillators like the Relative Strength Index (RSI) or Stochastic can offer additional confirmation for entry and exit points. Integration of ROC with volume indicators such as On-Balance Volume (OBV) or Chaikin Money Flow can validate price movements and increase trading accuracy.
Pairing ROC with trendline analysis aids in identifying trend reversals and support/resistance levels for strategic decision-making. Additionally, combining ROC with candlestick patterns improves the precision of trade entries and exits based on price action signals.
These combinations enhance ROC trading strategies by providing a more holistic view of the market through indicators like Keltner Channel, Momentum Indicator, centerline crossovers, Bullish divergence, Bollinger Bands, and Average True Range.
Setting ROC Parameters
When configuring the Relative Oscillator (ROC) parameters, traders can tailor the analysis by adjusting the number of periods for evaluating price changes. Experimenting with different parameter values can significantly impact the effectiveness of the indicator in generating winning trades.
Here are some key points to consider:
- Setting shorter periods such as 9 can provide more sensitive signals, allowing traders to react quickly to price changes.
- Longer periods like 25 or 200 offer a broader view of price movements, helping traders identify trends over a more extended period.
- Traders should experiment with various ROC parameters to find the optimal setting that aligns with their specific trading strategy and risk tolerance levels.
Managing Risk With ROC
Traders can effectively mitigate risks by leveraging the Rate of Change (ROC) indicator to identify potential trend reversals and overbought/oversold conditions. The ROC calculates the speed at which the price changes over a specified period, comparing the current price to a past price. When the ROC crosses above zero, it indicates an upward trend, while crossing below zero signifies a downward trend.
Traders can use the ROC in conjunction with other risk management tools to make informed decisions. By monitoring ROC values, traders gain insights into the momentum of price movements, enabling them to adjust their risk exposure accordingly. Divergences between price action and ROC can signal potential shifts in market sentiment, serving as early warnings for changes in risk levels.
Incorporating the ROC into risk management strategies can enhance the risk-reward ratio and help traders navigate unexpected market fluctuations effectively. By understanding how to interpret ROC values and trends, traders can optimize their risk management approach for more successful trading outcomes.
Evaluating ROC Performance
When evaluating ROC performance, it is essential to consider the various calculation methods available to ensure accurate results.
Interpreting ROC values accurately is crucial in understanding the indicator's signals and potential implications for trading decisions.
Utilizing ROC trends effectively can provide valuable insights into market momentum and assist in formulating successful trading strategies.
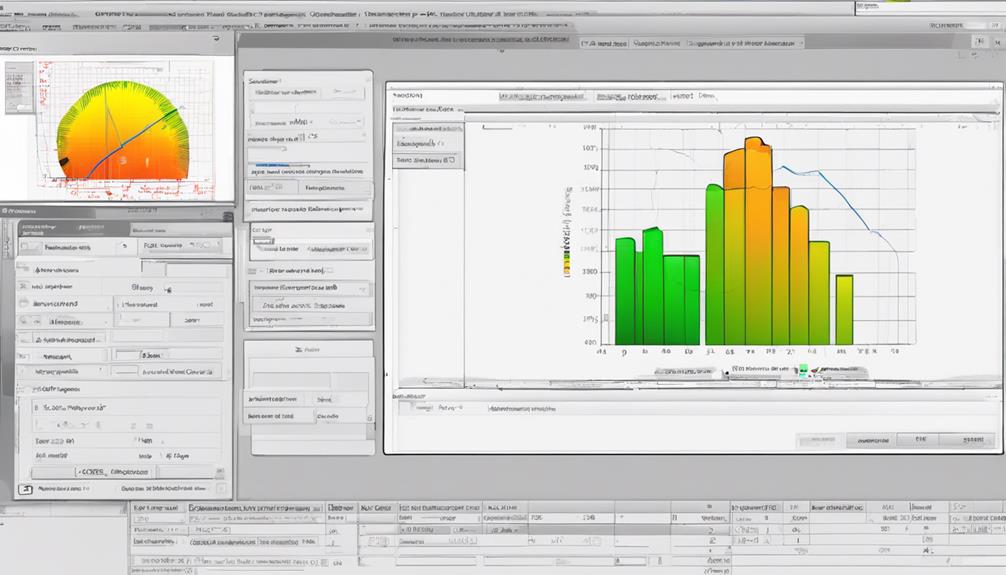
ROC Calculation Methods
In assessing ROC Calculation Methods for evaluating ROC performance, it is crucial to understand the nuances of how different approaches compare current price to price n periods ago. When analyzing ROC Calculation Methods, consider the following:
- Rate of Change (ROC) Formula Variations: Different methods may use variations in the calculation formula.
- Impact of Moving Average: Some methods incorporate moving averages to smooth out price fluctuations.
- Asset Volatility Considerations: The chosen method should account for the volatility of the asset being analyzed.
Understanding these nuances is essential for selecting the most suitable ROC calculation method to accurately interpret indicator signals and make informed trading decisions based on the measured speed of price changes.
Interpreting ROC Values
Assessing the performance of the Rate of Change (ROC) indicator involves a detailed examination of how positive and negative ROC values signal market momentum and potential trend reversals. Positive ROC values indicate bullish momentum, while negative values suggest bearish momentum, aiding in identifying overbought or oversold conditions.
Traders use ROC to pinpoint potential entry points based on bullish momentum or to anticipate potential trend reversals. By analyzing ROC for divergences from price trends, traders can gain insights into shifts in market direction. Divergence between price action and ROC can serve as a crucial indicator for potential trend reversals, guiding traders in making informed decisions.
Understanding these aspects is essential in implementing an effective ROC trading strategy.
Utilizing ROC Trends
To effectively evaluate the performance of the Rate of Change (ROC) indicator, traders must meticulously analyze the trends displayed in the indicator's values over a specified period. When utilizing ROC trends in Technical Analysis:
- Consider the consistency and magnitude of ROC movements to assess its effectiveness.
- Look for patterns in ROC trends such as increasing or decreasing values to gauge momentum.
- Compare ROC trends with price movements to identify correlations and potential trading opportunities.
Analyzing ROC trends alongside market indicators like Moving Line and trend lines can provide valuable insights into price action. The ROC oscillator, a type of momentum indicator, can help traders anticipate potential shifts in market direction as ROC is a leading indicator.
What Are the Best Practices for Using the ROC Indicator in Trading?
When it comes to trading, it’s important to implement the best trading strategies with ROC indicator to maximize success. One effective practice is to use the ROC indicator in combination with other technical indicators to confirm trend strength and potential reversal points. Implementing strict risk management alongside ROC indicator usage is also crucial for successful trading.
Frequently Asked Questions
How Do You Trade With ROC Indicator?
When trading with the ROC indicator, traders can utilize its overbought/oversold conditions, zero-line crossovers, divergence analysis, and trend line breakouts to make informed decisions. Combining ROC with other tools enhances trading strategies for improved outcomes.
What Is the Most Successful Trading Indicator?
The most successful trading indicator is one that accurately measures market momentum and trend acceleration, effectively identifying overbought and oversold conditions. Traders rely on such indicators to enhance decision-making, confirm trends, and pinpoint entry and exit points.
How Accurate Is ROC Indicator?
The accuracy of the ROC indicator varies based on market conditions and the securities being analyzed. Historical data suggests a 66% success rate, with notable outperformance in specific stocks and settings. Further validation through real-time testing is recommended.
How Do You Maximize Winning Trades?
To maximize winning trades, it is essential to implement a strategic approach that combines thorough market analysis, precise timing of entry and exit points, utilization of technical indicators, and risk management practices to optimize trade outcomes effectively.
Conclusion
In conclusion, the Rate of Change (ROC) indicator is a powerful tool for traders to measure momentum and identify trends in the market. By understanding the basics of ROC, interpreting signals effectively, implementing strategic approaches, and combining ROC with other indicators, traders can make informed decisions and improve their trading performance.
Managing risk with ROC and evaluating its performance can further enhance trading outcomes. As the saying goes, 'In trading, knowledge of indicators is key to success.'