
Imagine a seamless dance between two intricate technical indicators, guiding you through market shifts and potential trade setups. As you navigate the realm of trading strategies, ponder the synergy of RSI and Moving Averages Crossover.
Discover how these tools intertwine, offering insights into market momentum and trend reversals. Unveil the secrets of optimal entry and exit points, unlocking a world where precision meets opportunity.
Explore the depths of this guide to unveil a realm where analysis meets action, shaping your trading journey with precision and foresight.
Understanding Relative Strength Index (RSI)
In analyzing market dynamics, grasping the essence of Relative Strength Index (RSI) is paramount for making informed trading decisions. RSI, introduced by J. Welles Wilder Jr. in 1978, gauges momentum and strength of price movements in financial markets.
Oscillating between 0 and 100, RSI offers insights into overbought and oversold conditions, trend reversals, and potential entry/exit points. By comparing recent gains to losses over a set timeframe, RSI calculates price strength. Values above 70 signal overbought situations, while below 30 indicate oversold conditions.
Variations like Modified RSI and Stochastic RSI refine accuracy by considering historical volatility or merging RSI with stochastic oscillator features. Understanding RSI empowers you to navigate market fluctuations with a deeper comprehension of price movements and potential trade signals.
Utilizing Moving Averages in Trading
Utilizing moving averages effectively enhances traders' ability to identify trends and make informed decisions in the dynamic market environment. Traders commonly use Simple Moving Averages (SMA) and Exponential Moving Averages (EMA) to smooth out price fluctuations and determine market trends.
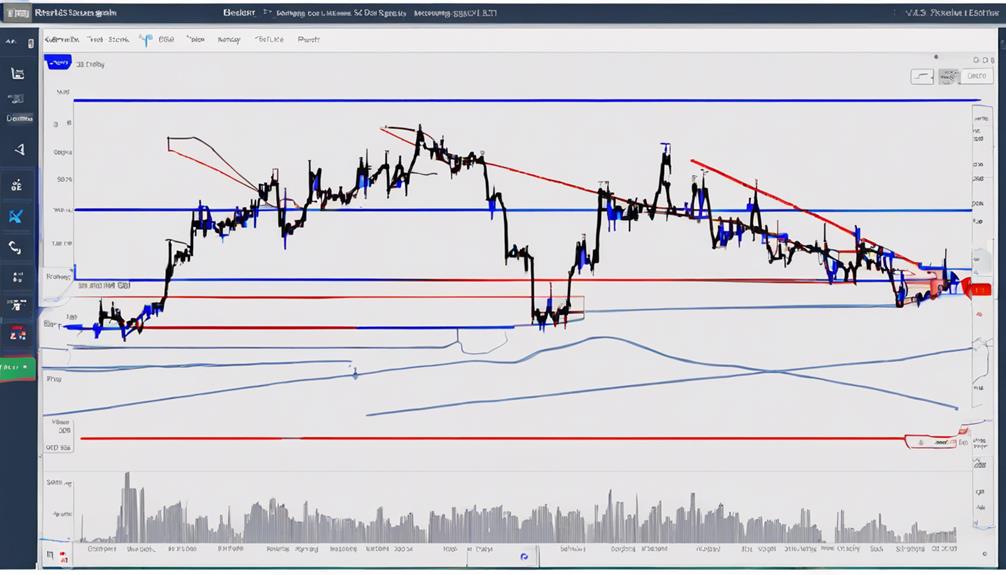
Strategies like the Golden Cross, Double and Triple Moving Average Crossovers provide buy and sell signals based on moving average interactions. The Moving Average Ribbon strategy assists traders in assessing trend strength by utilizing multiple moving averages simultaneously.
Interpreting RSI and Moving Averages Together
When analyzing market trends, integrating RSI with moving averages can offer you a more comprehensive understanding of potential price movements. By combining these indicators, you can identify overbought and oversold conditions – RSI crossing above 70 signifies overbought, while below 30 indicates oversold.
This integration enhances trend identification and provides stronger trading signals. Traders often seek confirmation of potential market movements by aligning moving averages with RSI levels. Utilizing moving averages alongside RSI helps validate signals, improving overall trading strategies.
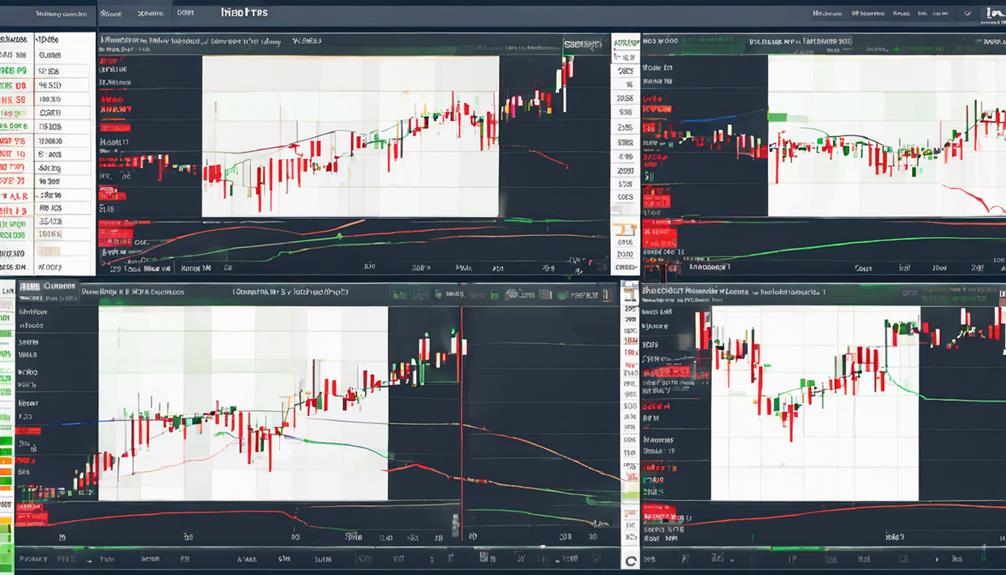
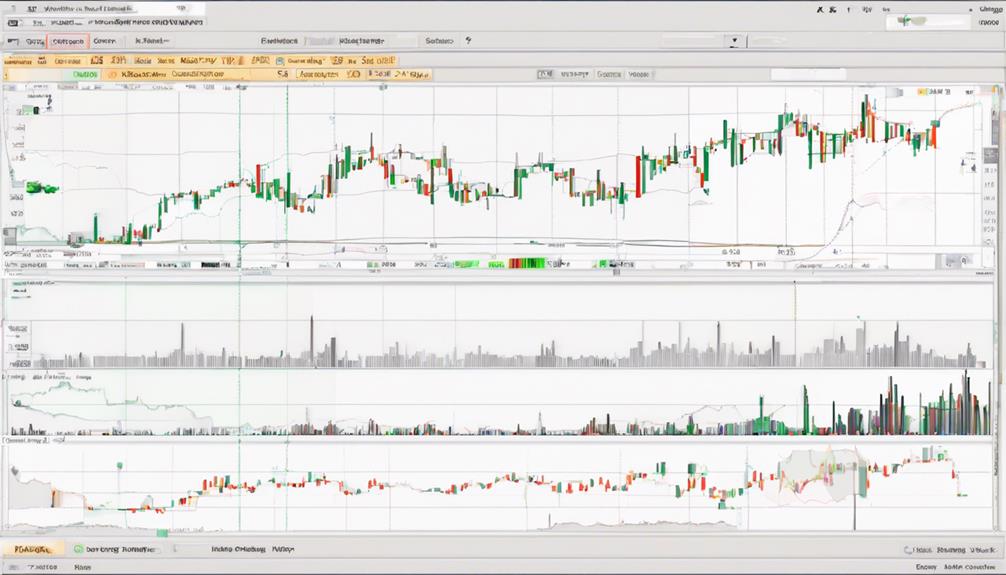
Platforms like Thinkorswim offer indicators visualizing RSI and moving average crossovers, aiding in decision-making based on market movements. This combined analysis can be instrumental in making informed trading decisions.
Strategies for RSI and Moving Averages Crossover
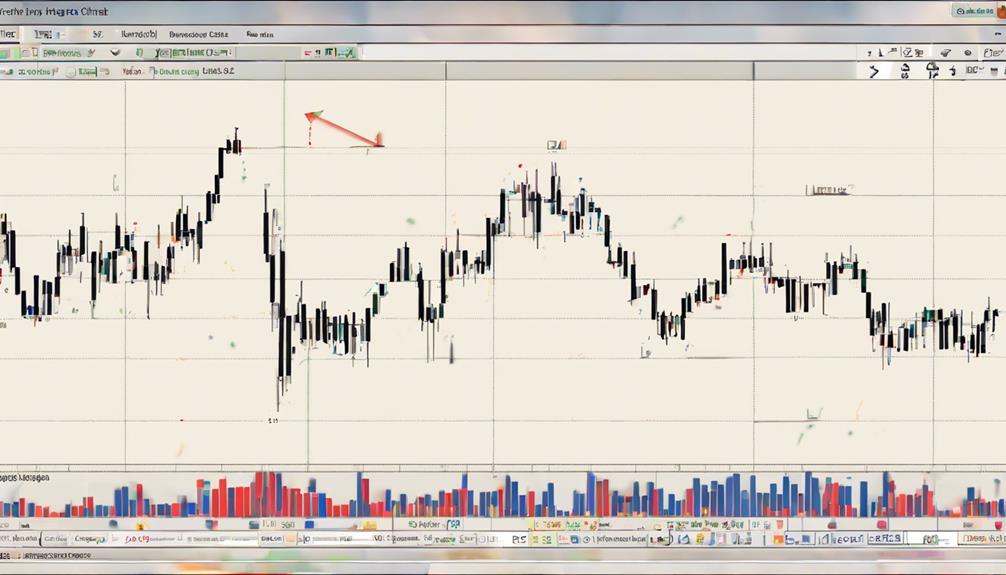
To effectively implement the RSI and Moving Averages Crossover strategy, traders integrate momentum and trend indicators for precise trade signals. By combining moving average crossovers with RSI values above 70 or below 30, traders can identify potential entry and exit points in the market. This strategy aids in recognizing trend reversals and shifts in market momentum.
Using RSI and moving averages together enhances signal accuracy, providing confirmation for trading decisions. Traders watch for the intersection of moving averages and specific RSI levels to gauge market momentum shifts effectively.
This approach not only helps in determining entry and exit points but also improves the overall accuracy of trade signals by leveraging both momentum indicators and trend analysis.
How Can I Use Stochastic Oscillator in Conjunction with Moving Averages Crossover for Trading?
To improve your trading strategy, consider using the RSI and Stochastic Oscillator strategy in conjunction with moving averages crossover. By combining these technical indicators, you can gain a more comprehensive view of market trends and potential entry/exit points, leading to more informed trading decisions.
Implementing RSI and Moving Averages in Trading
How can traders effectively incorporate RSI and moving averages into their trading strategies?
By combining the Relative Strength Index (RSI) with moving averages, traders can enhance their decision-making process. This integration assists in identifying potential trend reversals more accurately. The crossover of RSI and moving averages serves as critical signals for determining entry and exit points in the market.
This strategy offers a comprehensive approach to analyzing market momentum and trends. It's essential for traders to understand the interaction between RSI and moving averages to develop a well-rounded trading strategy. By utilizing these tools together, traders can make more informed decisions and improve their overall trading performance.
Frequently Asked Questions
How Do You Combine RSI and Moving Average?
To combine RSI and moving averages, you analyze momentum with RSI and trends with moving averages. Look for alignment between RSI signals and moving average crossovers for confirmation. This approach enhances trading strategy effectiveness.
What Is the Best Moving Average Crossover Combination?
For the best moving average crossover combo, consider using the 50-day and 200-day for long-term trends, or the 20-day and 50-day for short-term plays. Experiment with different combinations to find what works best for you.
What Is the 50 200 Moving Average Crossover Strategy?
You're diving into the 50 200 Moving Average Crossover Strategy, a powerful tool for spotting trend shifts. When the 50-day moving average overtakes the 200-day average, bulls cheer; when it falls below, bears roar. Watch those averages dance!
What Is the Best Moving Average With Rsi?
For optimal RSI signals, consider using the 14-day SMA or 9-day EMA based on your trading speed preference. Experiment with different moving averages to find the best fit for your strategy, timeframe, and market conditions.
Conclusion
Congratulations! You've now mastered the art of combining RSI and moving averages to enhance your trading strategies.
Remember, the key to success lies in staying disciplined, analyzing data meticulously, and adapting to market trends.
So go forth, armed with your newfound knowledge, and conquer the trading world with confidence.
Happy trading!