
When it comes to predicting market movements, volume-based indicators like the OBV, MFI, and VWAP are your go-to tools for uncovering hidden insights.
But why are these indicators so crucial for your trading success? Understanding the significance of volume in market analysis can be the key to unlocking profitable opportunities and staying ahead of the curve.
So, how exactly do volume-based indicators empower you to make more informed decisions and navigate the complexities of the market landscape? Let's explore together.
Importance of Volume-Based Indicators
Understanding volume-based indicators is paramount for assessing market dynamics and enhancing trading strategies. Volume plays a crucial role in providing valuable insights into market movements. Volume indicators, such as the On-Balance Volume (OBV) or the Volume Weighted Average Price (VWAP), offer a quantitative measure of market participation, reflecting the conviction behind price changes.
By analyzing volume alongside price movements, traders can better interpret the strength and sustainability of trends. Volume indicators help confirm the validity of price movements, indicating whether a trend is likely to continue or reverse. Moreover, they aid in identifying potential breakouts and reversals, allowing traders to anticipate market shifts with more confidence.
Incorporating volume-based indicators into your analysis can significantly enhance your ability to make informed trading decisions.
Role of Volume in Market Forecasting
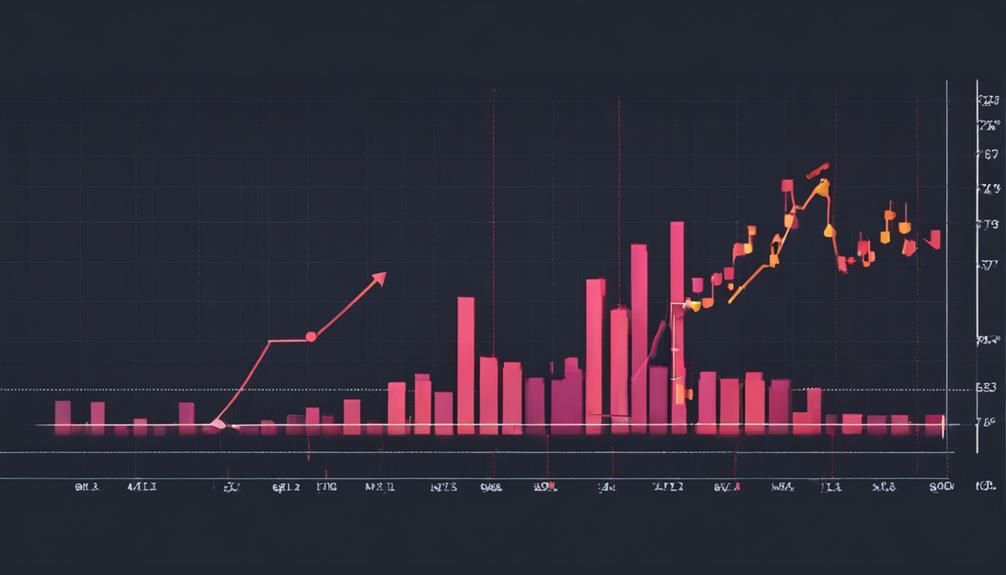
Analyzing volume dynamics is pivotal for accurate market forecasting and strategic decision-making in trading scenarios. When considering the role of volume in market forecasting, several key factors come into play:
- Volume as a Market Indicator: High trading volume often indicates increased market activity and can signal significant price movements.
- High Trading Activity: Peaks in trading volume can suggest areas of high interest or potential turning points in the market.
- Accumulation/Distribution Line: This indicator uses volume flow to gauge the accumulation or distribution of a financial instrument, providing insights into potential price trends.
Understanding these aspects of volume dynamics can enhance your ability to forecast market movements effectively and make informed trading decisions based on volume analysis.
Types of Volume Indicators
Utilizing various volume indicators is essential for comprehensive market analysis and informed decision-making in trading environments.
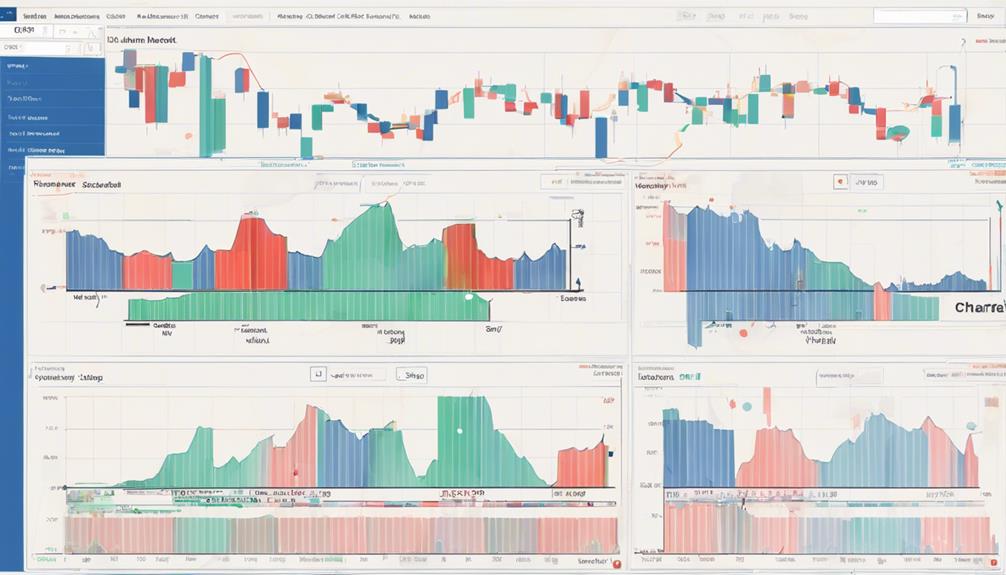
Volume indicators such as On-Balance Volume (OBV), Money Flow Index (MFI), Volume-Weighted Average Price (VWAP), and Accumulation/Distribution Line (Accu) provide valuable insights into trading volumes and market trends.
OBV calculates the conviction behind stock movements by summing up volume on up days and subtracting volume on down days. MFI uses time, volume, and price to identify overbought or oversold areas.
VWAP offers the average price an asset has traded at, incorporating both price and volume for trend confirmation. Accu shows the relationship between price and volume, aiding in predicting future price trends based on volume activity.
These volume indicators are crucial tools for accurate market analysis and prediction.
Advantages of Using Volume-Based Indicators
Have volume-based indicators revolutionized market analysis and prediction strategies? Volume-based indicators offer significant advantages in market analysis and prediction by providing a deeper understanding of market dynamics. Here are some key advantages of using volume-based indicators:
- Insight into Market Conviction: Volume-based indicators reveal the strength behind price movements, helping you gauge market sentiment accurately.
- Early Detection of Trend Reversals: By identifying divergences between volume and price action, traders can anticipate potential trend changes before they occur.
- Informed Decision-Making: Incorporating volume analysis allows for more informed decisions on when to enter or exit trades, enhancing overall trading strategies.
Utilizing volume-based indicators like OBV and MFI can greatly improve the accuracy of market predictions and optimize trading outcomes.
Implementing Volume Indicators in Trading
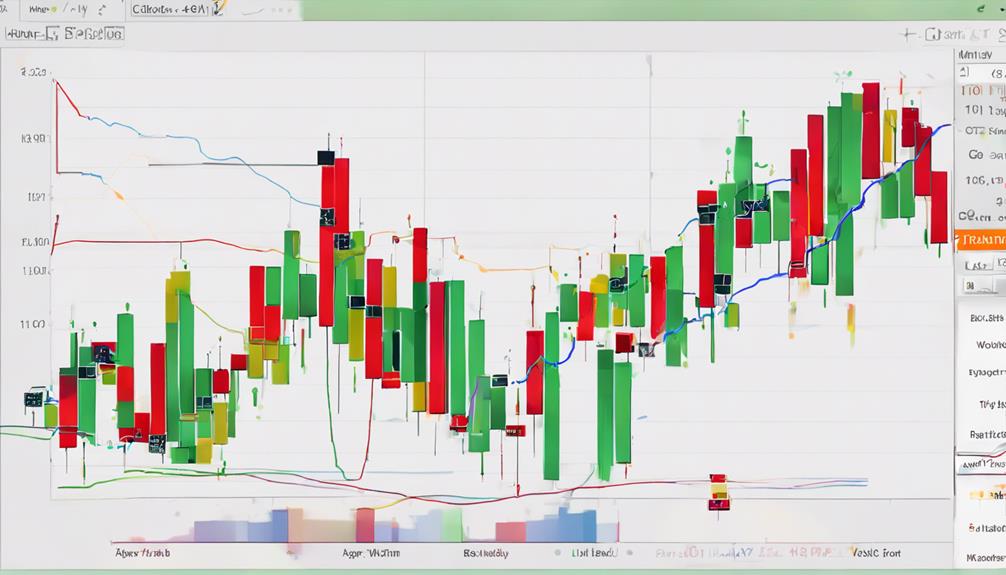
By incorporating volume indicators like OBV, MFI, VWAP, and Accu into your trading strategies, you can effectively analyze market trends and make informed decisions based on buying and selling pressure data. These indicators are crucial tools in trading strategies as they provide insights into market sentiment and help predict price movements accurately.
Traders rely on volume indicators to confirm trends, spot potential reversals, and determine optimal entry and exit points. Implementing volume indicators in your trading approach can significantly enhance the accuracy of market predictions and improve overall trading outcomes.
Understanding and utilizing these volume-based indicators is key to developing successful trading strategies and staying ahead in the dynamic world of financial markets.
How Can Volume-Based Indicators Help Predict Market Trends?
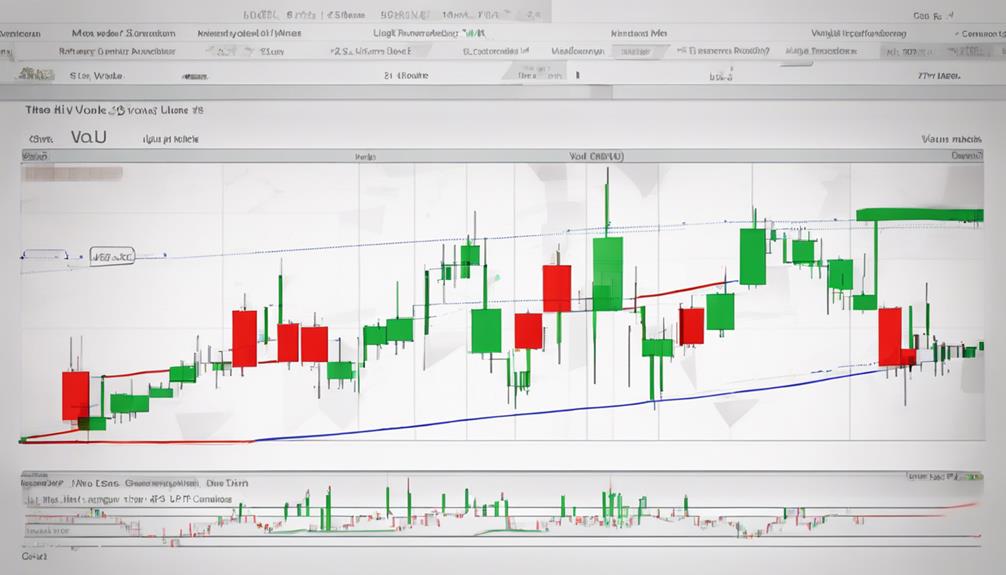
Volume indicators play a crucial role in market trend analysis. By analyzing trading volume, investors can gauge the strength of a trend. High volume typically confirms a trend, while low volume may signal a reversal. Utilizing market trend analysis tips volume indicators can help identify potential trend changes and make more informed trading decisions.
How Do Volume-Based Indicators and Momentum Indicators Work Together in Market Prediction?
Volume-based indicators in algorithmic trading measure the strength of buying and selling pressure, while momentum indicators in algorithmic trading track the velocity of price movements. By using both types of indicators, traders can gain a more comprehensive understanding of market dynamics and make more informed predictions about future price movements.
Frequently Asked Questions
Why Is the Volume Indicator Important?
Understanding why volume indicators are important is crucial for informed trading decisions. They provide insights into market sentiment, confirm trends, and help identify entry and exit points. Utilize indicators like OBV, MFI, VWAP for strategic advantage.
What Is the Use of Volume in Stock Market Predictions?
In stock market predictions, volume acts as a key indicator of market interest and trend strength. High volume alongside price movements signals potential trend continuations. Divergence between volume indicators and price can indicate shifts in sentiment or reversals.
What Is the Volume Prediction Indicator?
The Volume Prediction Indicator utilizes historical data to forecast trading volume. It aids in anticipating market movements based on volume levels, helping predict stock price changes. Enhance decision-making and timing in trades with this tool.
What Does the Volume Indicator Tell You?
Volume indicators tell you about buying and selling pressure in the market. They reveal the strength behind price movements. Divergence between volume indicators and stock price can signal reversals. Use them to confirm trends, spot entry/exit points, and predict future price moves.
Conclusion
You may think volume-based indicators are just numbers on a screen, but they hold the key to unlocking the secrets of the market.
By paying attention to trading volume, you can see beyond the surface and decipher the hidden messages of investor sentiment.
So next time you dismiss volume indicators, remember that they're the breadcrumbs leading you to profitable trading decisions.
Embrace the data, trust the numbers, and let volume be your guiding light in the unpredictable world of trading.