
In the world of finance, understanding technical indicators can significantly enhance your trading acumen. By demystifying complex market signals and providing a structured approach to analyzing trends, this guide offers a roadmap to improving your investment strategies.
Whether you're a novice exploring the nuances of indicators or an experienced trader looking to fine-tune your skills, the comprehensive insights within this guide promise to elevate your decision-making process in the dynamic world of financial markets.
Importance of Technical Indicators
Understanding technical indicators is crucial for traders seeking to analyze price movements in financial markets effectively. These indicators provide quantitative data essential for evaluating market trends, determining entry and exit points, and predicting potential reversals.
By utilizing historical price data and mathematical calculations, technical indicators offer valuable insights into trend strength, momentum, and overall market dynamics. Incorporating these tools into your trading strategy enhances your ability to make informed decisions based on data-driven analysis rather than intuition.
Common Types of Technical Indicators
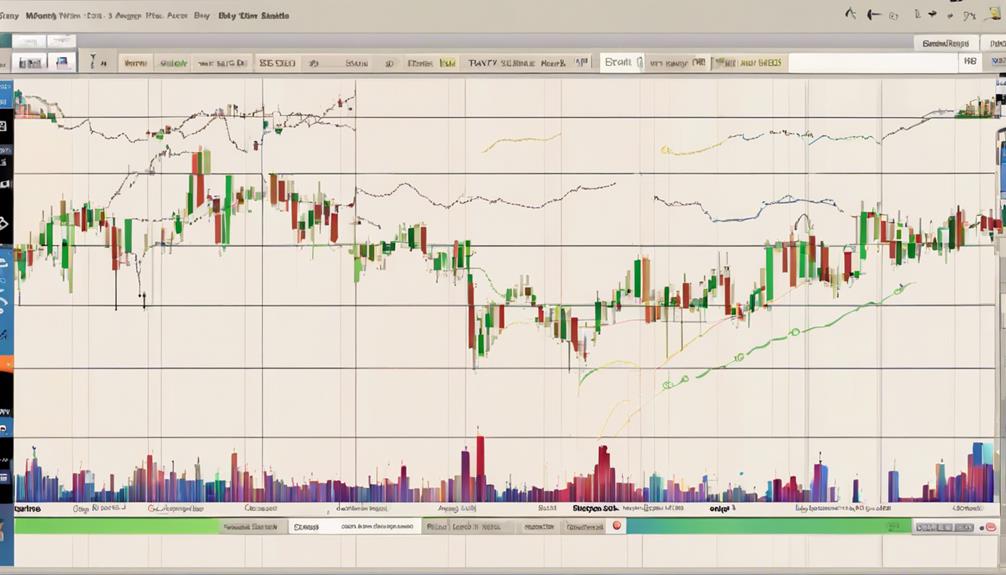
To effectively analyze price movements and make informed trading decisions, mastering common types of technical indicators is essential.
Moving averages smooth out price data to identify trends, while the Relative Strength Index (RSI) measures overbought or oversold conditions.
The Moving Average Convergence Divergence (MACD) combines moving averages to signal trend changes, and Bollinger Bands indicate volatility levels.
Stochastic oscillators help traders spot potential trend reversals and confirm market momentum.
These indicators play a crucial role in helping traders identify trends and determine optimal entry and exit points in the market.
Understanding how to interpret overbought and oversold conditions, along with recognizing signals from these indicators, can significantly enhance your ability to make strategic trading decisions.
Understanding Technical Indicator Signals
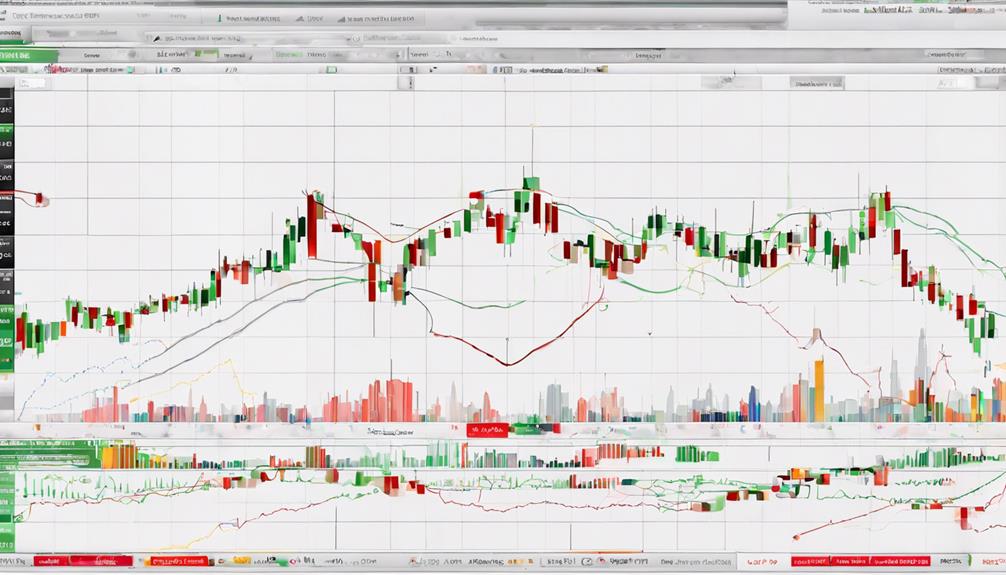
Have you ever wondered how technical indicators like RSI and MACD provide crucial signals for entry and exit points in trading? Understanding technical indicator signals is vital for making effective trading decisions.
Here are some key points to consider:
- Moving averages crossing over or under can indicate potential trend changes.
- Divergence between price and indicator signals may suggest possible trend reversals.
- Oversold or overbought conditions from indicators can signal potential price corrections.
Being able to interpret these signals correctly is essential for traders looking to navigate the markets successfully and make informed decisions based on the information provided by these technical indicators.
Implementing Technical Indicators in Trading
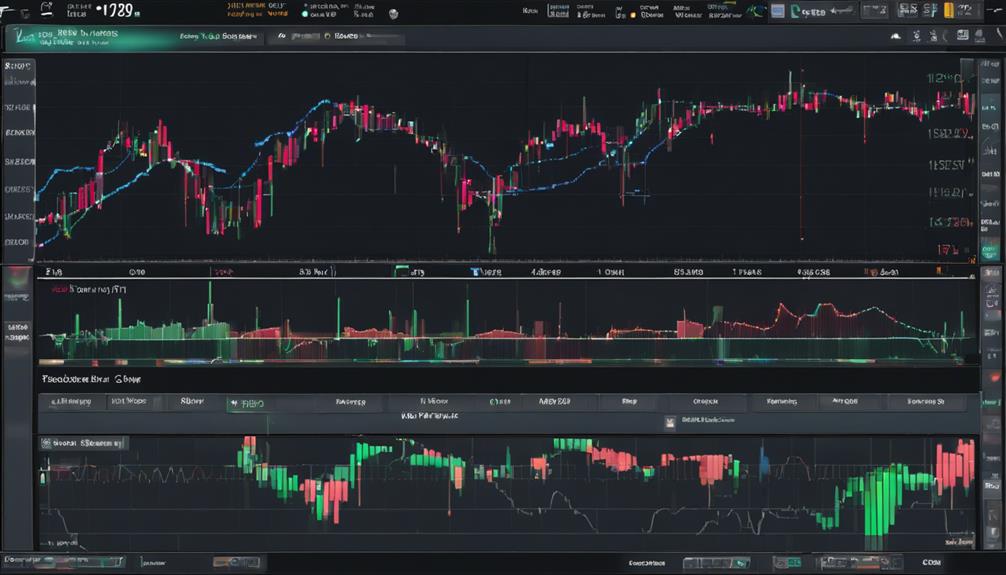
Implementing technical indicators effectively in trading involves a strategic understanding of how they signal entry and exit points based on market trends and momentum. Traders rely on indicators like RSI and MACD to gauge market strength and direction.
Moving averages are utilized to identify trend patterns by smoothing out price fluctuations. Bollinger Bands assist in recognizing overbought or oversold market conditions, indicating potential reversal points.
By analyzing these indicators, traders can make informed decisions about when to enter or exit trades. It's crucial to consider factors like market volatility and chosen timeframes when applying technical indicators to trading strategies.
Mastering the interpretation of these signals can significantly enhance your trading performance and decision-making process.
Advanced Strategies With Technical Indicators
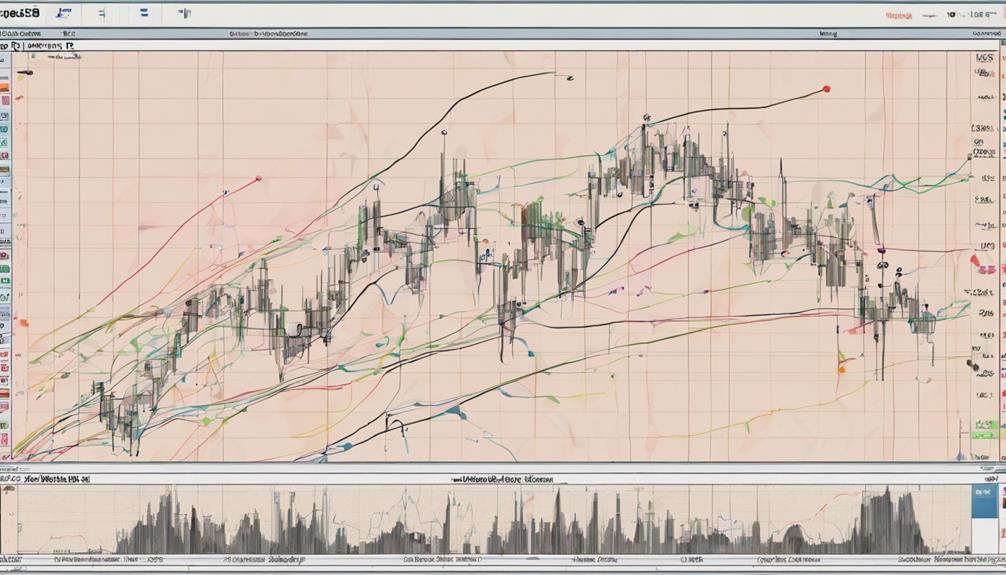
Considering the complexity of modern markets, utilizing a combination of technical indicators is essential for developing advanced trading strategies. Incorporating advanced strategies with technical indicators can significantly enhance your trading performance. To succeed in this realm, you should consider the following key elements:
- Combining indicators like MACD, Bollinger Bands, and Fibonacci retracement levels for more accurate signals.
- Utilizing divergence analysis to identify potential trend reversals.
- Implementing volume analysis to confirm the strength of price movements.
-Are the technical indicators in the comprehensive step-by-step guide the same as the ones unveiled in the comprehensive guide?
Yes, the technical indicators in the comprehensive step-by-step guide are the same as the ones unveiled in the comprehensive guide. You can find detailed information on various technical indicator types explained in both guides to help you make informed trading decisions.
Frequently Asked Questions
How to Learn Technical Analysis Step by Step?
To learn technical analysis step by step, start with basic concepts like trendlines and chart patterns. Progress to studying indicators such as moving averages and RSI. Practice on historical data, combine indicators for analysis, and advance systematically for mastery.
How Do You Study Technical Indicators?
To study technical indicators effectively, start by understanding their mathematical formulas. Analyze their specific purpose in price movement analysis. Apply indicators on historical charts to spot patterns. Consider different timeframes' impact. Be aware of relying solely on indicators for trading decisions.
What Are the Four 4 Basic Principles of Technical Analysis?
Explore the four basic principles of technical analysis: price action, volume, trends, and market psychology. Analyze historical price movements, trading activity strength, market direction identification, and emotional impact on prices. Mastering these principles enhances your trading skills.
Which Technical Indicator Is the Most Accurate?
When deciding the most accurate technical indicator, consider the Relative Strength Index (RSI) for overbought or oversold signals, Moving Average Convergence Divergence (MACD) for trend strength, Bollinger Bands for volatility insights, and Stochastic Oscillator for trend reversals.
Conclusion
You have now mastered the essential technical indicators needed to elevate your trading game.
By understanding signals, implementing strategies, and utilizing advanced techniques, you're equipped to make informed decisions in the financial markets.
But, can you apply these tools effectively to capitalize on opportunities and manage risks?
Keep honing your skills and analyzing market data to stay ahead of the game.
Success awaits those who are prepared and strategic in their approach.