
Navigating the intricacies of technical indicators can be a daunting task for traders seeking to enhance their market analysis skills. When it comes to the Williams %R indicator, a structured approach to understanding its functionality can pave the way for informed decision-making in trading scenarios.
By breaking down the key components of this momentum oscillator and elucidating its practical applications, traders can equip themselves with a valuable tool for navigating the complexities of the financial markets.
The path to mastering the Williams %R indicator lies in unraveling its nuances and grasping its implications for market dynamics – a journey worth embarking on for those keen on refining their trading strategies.
Williams %R Indicator Overview
The Williams %R indicator, created by Larry Williams, serves as a valuable tool for traders seeking to gauge overbought and oversold conditions within the market. This technical indicator measures momentum on a scale from 0 to -100, with values above -20 signaling overbought conditions and readings below -80 indicating oversold conditions.
By comparing a security's closing price to the highest high over a specific period, the Williams %R helps traders identify potential reversal points based on price movements. Traders often use this indicator to generate buy or sell signals when the indicator ventures into overbought or oversold territories.
When the Williams %R is near or above -20, it suggests that the price is near its high, potentially signaling an overbought market. Conversely, a reading close to or below -80 indicates that the price is near its low, hinting at an oversold market condition.
Understanding these dynamics can assist traders in making informed decisions regarding market entry and exit points based on the Williams %R indicator's insights.
Understanding the Formula
Analyzing market momentum, the Williams %R formula calculates the indicator value by comparing the closing price to the highest high and lowest low over a specified period. This calculation is essential for traders to understand where the current price stands relative to recent highs and lows. Key points to consider about the Williams %R formula include:
- The formula is expressed as (Highest High – Close) / (Highest High – Lowest Low).
- It yields values between 0 and -100, indicating overbought and oversold conditions.
- Traders can utilize the formula to identify potential trade signals and anticipate trend reversals based on the indicator's values.
Understanding the Williams %R formula empowers traders to make informed decisions regarding market entry and exit points. By interpreting the values generated through this formula, traders can effectively navigate market trends and capitalize on profitable opportunities.
Interpreting Williams %R Readings
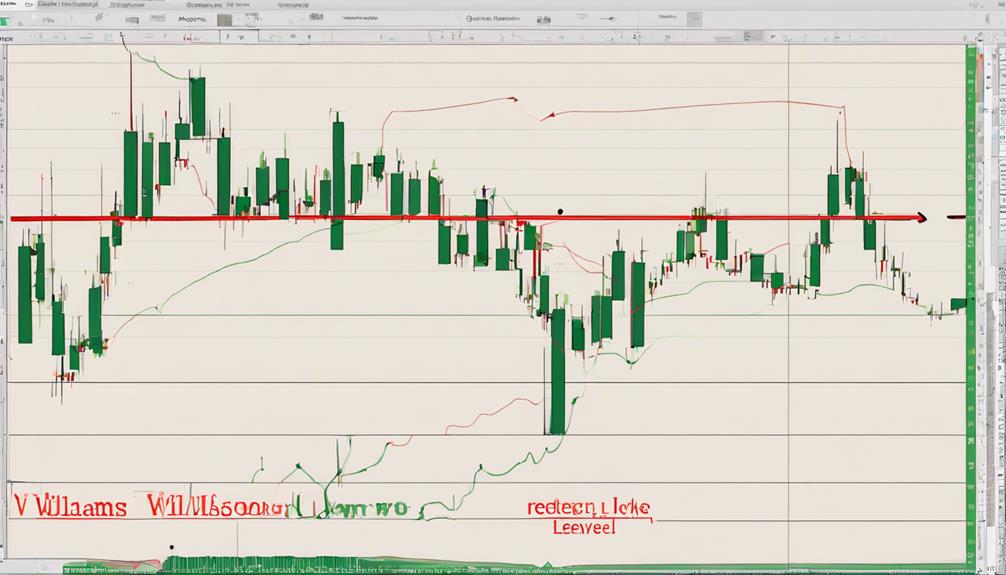
When evaluating Williams %R readings, traders should pay close attention to the levels above -20 and below -80 to assess potential market conditions accurately. A reading above -20 suggests an overbought condition, indicating a possible selling opportunity, while a reading below -80 signifies an oversold condition, signaling a potential buying opportunity. Traders often use the Williams %R indicator to identify entry and exit points based on these overbought or oversold levels.
When the Williams %R indicator moves near the highs, it can indicate that the price is near its peak, potentially leading to a reversal. Understanding that oversold means the price has decreased significantly over the last 14 periods helps traders interpret the momentum indicator more effectively.
Comparing Williams %R With Stochastic Oscillator
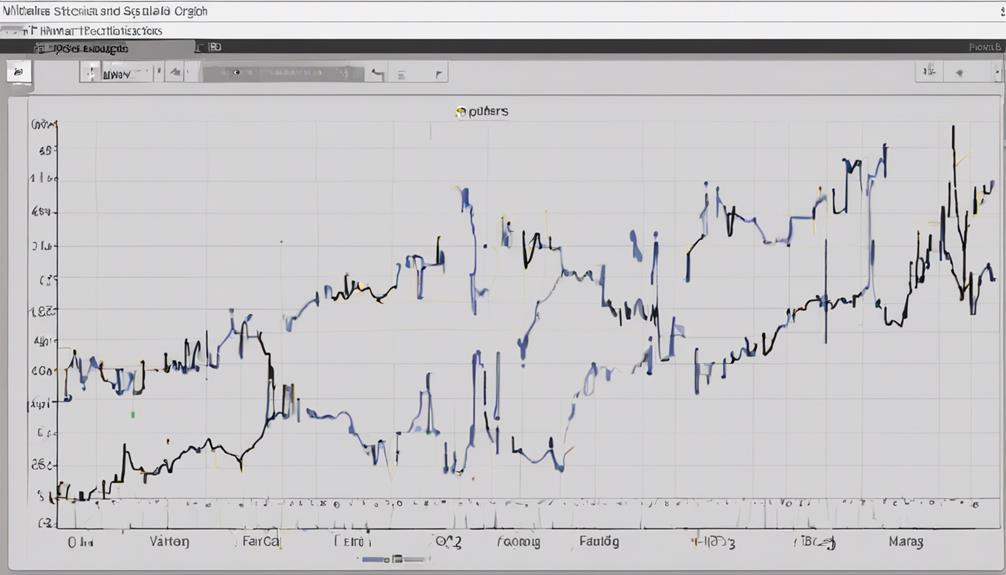
Drawing a comparison between the Williams %R indicator and the Stochastic Oscillator reveals distinct differences in their calculation methodologies and scale interpretations.
- The Fast Stochastic Oscillator compares the closing level of a security relative to the lowest low over a specific lookback period, while Williams %R corrects it relative to the highest high.
- Williams %R is on a scale from 0 to -100, indicating overbought conditions above -20 and oversold conditions below -80. In contrast, the Stochastic Oscillator is on a scale from 0 to 100.
- Both indicators serve as momentum indicators but vary in how they calculate their values. Williams %R focuses on the close relative to the high, while the Stochastic Oscillator looks at the close relative to the low.
Understanding these differences is crucial for investors to choose the indicator that aligns best with their investment objectives and trading strategies.
Managing Limitations and Risks

Mitigating potential losses and enhancing decision-making effectiveness in trading with the Williams %R indicator requires a comprehensive understanding of its limitations and associated risks. Williams %R is a momentum technical indicator that traders use to determine overbought or oversold conditions in the market. It calculates Williams %R based on the recent closing price in relation to the high for the lookback period.
However, it is essential to note that overbought or oversold readings do not always lead to immediate price reversals, as signals from Williams %R primarily indicate proximity to recent price ranges rather than definitive trend changes. To manage risks effectively, traders should implement proper risk management strategies and consider combining Williams %R signals with other indicators for confirmation and informed decision-making.
It is crucial to recognize the limitations of Williams %R signals and not rely solely on them for investment advice, but rather incorporate them into a broader trading strategy for better risk management.
How Can I Use the Williams %R Indicator to Make Informed Decisions in Trading?
When trading, understanding Williams %R signals is crucial for making informed decisions. By analyzing the overbought and oversold conditions indicated by this momentum oscillator, traders can anticipate potential trends and set appropriate entry and exit points. Ultimately, using Williams %R can help improve the accuracy of trading decisions.
Frequently Asked Questions
How Do You Read a Williams R Indicator?
To read a Williams %R indicator, observe values below -20 for overbought signals and above -80 for oversold signals. Values above -50 indicate bullish momentum, while below -50 suggest bearish trends. Crosses of thresholds like -20 and -80 can generate trading signals.
What Is the Williams %R Strategy?
The Williams %R strategy is a tool for traders to identify market conditions. It involves buying below -80 and selling above -20, aiming to catch trend reversals. This strategy aids in determining entry and exit points for trading positions efficiently.
What Is the Formula for Williams R?
The Williams %R formula measures the relationship between the highest high, current closing price, and the high-low range. This calculation, ranging from -100 to 0, helps traders identify overbought conditions and potential entry/exit points in the market.
What Is the Best Setting for Williams %R?
The best setting for Williams %R is typically a 14-day period, offering a balanced view of overbought and oversold conditions. This widely used timeframe, with default thresholds at -20 and -80, can be adjusted based on individual preferences and market dynamics.
Conclusion
In conclusion, mastering the Williams %R indicator can provide traders with valuable insights into market conditions and potential entry and exit points. By understanding the formula, interpreting readings accurately, and comparing it with other indicators like the Stochastic Oscillator, traders can make informed decisions and manage risks effectively.
One interesting statistic to note is that studies have shown that combining Williams %R with other technical analysis tools can improve the accuracy of trade signals by up to 30%.