
The Trix Indicator's categorization as a momentum oscillator stems from its unique methodology that captures the essence of price movements in financial markets. Through a sophisticated triple-smoothed EMA calculation process, Trix hones in on significant trends while filtering out noise, enabling traders to pinpoint crucial momentum shifts.
This oscillator plays a pivotal role in identifying key entry and exit points, shedding light on the market's underlying strength and direction. However, the true beauty of the Trix Indicator lies in its ability to…
Trix Indicator Overview
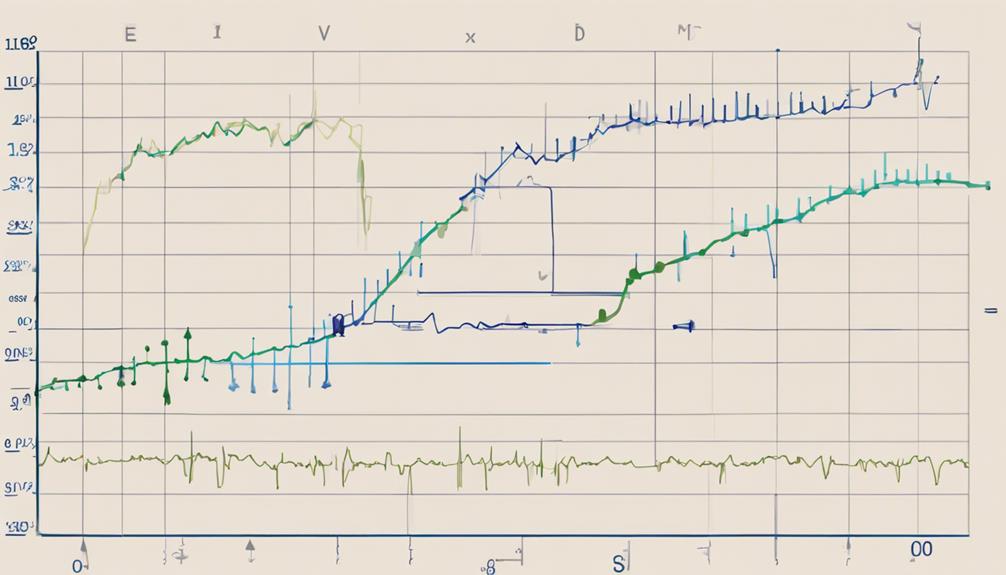
Typically, the Trix Indicator Overview provides traders with a comprehensive understanding of how the triple exponential average indicator functions to analyze market trends and momentum in price movements. TRIX, known as a momentum oscillator, aids traders in identifying significant changes in market trends by filtering out insignificant price fluctuations.
By calculating TRIX as an EMA of an EMA of an EMA, the indicator offers a smoothed representation of price movements, enabling traders to focus on the underlying momentum. Furthermore, TRIX can indicate overbought and oversold conditions in the market, helping traders anticipate potential reversals or continuations in price trends.
Positive TRIX values typically suggest an uptrend, while negative values indicate a downtrend. Values near 0 signal a neutral market stance, highlighting the importance of TRIX in momentum analysis and trend identification within the financial markets. Understanding the nuances of TRIX as an indicator is essential for traders seeking to make informed decisions based on market momentum and trends.
Calculation of Trix Indicator
The calculation of the Trix Indicator involves a triple smoothed exponential moving average (EMA) formula to analyze market trends and momentum in price movements. This process includes three levels of smoothing: a single-smoothed EMA, followed by a double-smoothed EMA, and finally, a triple-smoothed EMA.
Typically, the TRIX calculation period is set at 14, but traders have the flexibility to adjust this parameter based on their trading strategies. The triple smoothing characteristic of TRIX is significant as it filters out insignificant price movements, allowing traders to focus on substantial price changes.
Interpreting Trix Signals
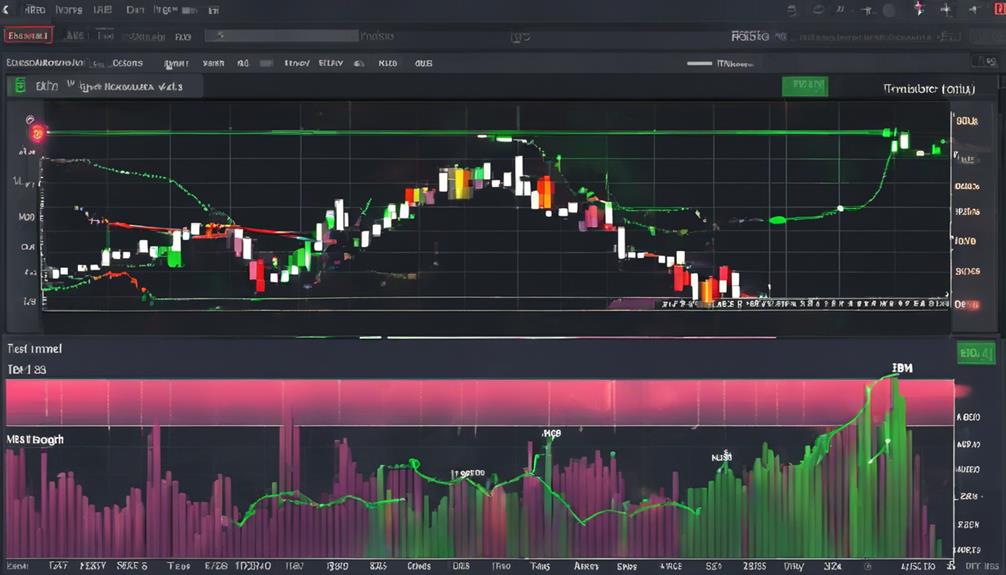
Interpreting Trix Signals involves analyzing the generated signals based on the cross of the Zero Line and divergence signals to gauge market momentum and potential turning points. When interpreting TRIX signals, traders consider the following:
- Zero Line Cross Signals: The crossing of the TRIX line above the zero line can indicate a bullish signal, suggesting potential buying opportunities. Conversely, a TRIX line crossing below the zero line may signal a bearish trend, indicating potential selling opportunities.
- Divergence Signals: Divergences between price movements and TRIX values are crucial in interpreting TRIX signals. Bullish divergence occurs when the price makes lower lows while TRIX makes higher lows, signaling a possible reversal to the upside. On the other hand, bearish divergence occurs when the price makes higher highs while TRIX makes lower highs, indicating a potential downward reversal.
- Identifying Overbought and Oversold Conditions: TRIX is a momentum oscillator that helps traders identify overbought and oversold conditions in the market. When TRIX reaches extreme levels, it may suggest a potential reversal in the price trend.
- Highlighting Potential Turning Points: TRIX highlights extremes in price action and can help traders identify potential market turning points. However, traders should be cautious as TRIX may struggle to provide accurate signals in range-bound trading conditions.
Trix Indicator as a Momentum Oscillator

Considering its role as a momentum oscillator, the Trix Indicator plays a crucial role in assessing market dynamics and identifying potential trend shifts. The Triple Exponential Moving Average (EMA) calculated based on the price change of a security forms the core of the Trix Indicator. By smoothing out price movements, it focuses on significant changes, making it a reliable momentum indicator for traders.
TRIX assists traders in gauging the momentum behind price fluctuations, providing valuable insights for making informed trading decisions. Additionally, it aids in identifying overbought or oversold conditions, helping traders time their entry and exit points effectively.
The signal line generated by TRIX is used in conjunction with the indicator line to provide trade signals. This dual-line system enhances the effectiveness of TRIX in technical analysis and trading strategies, making it a valuable tool for traders seeking to capitalize on market momentum.
Combining Trix With Other Indicators
When combining Trix with other indicators, a synergistic analysis approach can enhance traders' ability to identify optimal entry and exit points in various market conditions.
To achieve this, traders can consider the following strategies:
- Combining TRIX with RSI: This combination can be beneficial for pinpointing entry and exit points in range-bound markets where both indicators complement each other's strengths.
- TRIX and MACD for Trend Identification: Utilizing TRIX together with MACD can improve the accuracy of trade signals by providing a comprehensive view of the market trend.
- Zero Line Crossover Signals: When TRIX crosses the zero line along with a MACD crossover, it can serve as a potential entry signal, indicating a shift in market momentum.
- Leading Signals and Trade Probability: By integrating TRIX with other indicators, traders can receive leading signals that enhance the likelihood of successful trades, thereby increasing trade signal accuracy and overall profitability.
Can the Trix Indicator be Used to Predict Market Momentum?
The TRIX indicator can help traders predict market momentum by identifying bullish or bearish signals. This technical analysis tool measures the rate of change in a triple-smoothed moving average, providing insight into whether a trend is gaining or losing strength. Understanding TRIX can enhance market forecast accuracy.
Frequently Asked Questions
Is a Trix a Momentum Oscillator?
Yes, TRIX is indeed a momentum oscillator. It measures the rate of price change, focusing on trend identification and momentum in price movements. By filtering out insignificant price actions, TRIX helps traders assess trend strength and potential reversals.
How Does the TRIX Indicator Work?
The TRIX indicator operates by computing triple-smoothed EMAs to accentuate recent price changes and momentum levels. It identifies overbought and oversold conditions, aiding traders in predicting market trends and making informed trading decisions.
What Is the Difference Between an Oscillator and an Indicator?
An oscillator, distinct from a general indicator, oscillates around a centerline or specific levels to indicate market conditions. It helps identify overbought and oversold situations, offering visual insights into price movements and aiding in momentum-based decision-making for traders in range-bound markets.
What Is a Momentum Oscillator?
A momentum oscillator is a technical tool that measures the rate and strength of price changes in a security. It helps traders identify market extremes, assess trend momentum, and make informed decisions on entry and exit points.
Conclusion
In conclusion, the Trix Indicator's triple-smoothed EMA calculation method allows traders to identify momentum shifts and potential entry/exit points in financial markets.
By filtering out insignificant price fluctuations, Trix helps traders gauge market momentum and trend strength.
An interesting statistic to note is that studies have shown that incorporating the Trix Indicator into trading strategies can increase the accuracy of trade signals by up to 20%, providing valuable insights for informed decision-making.