
To grasp market breadth with the Advance-Decline Line (ADL), you must delve into five key strategies that can elevate your understanding of market dynamics.
From analyzing trends to interpreting signals, each method offers a unique perspective on navigating the complexities of market breadth.
By implementing these strategies, you can gain a deeper insight into market movements and potentially enhance your decision-making process.
So, are you ready to unlock the secrets of market breadth using the ADL indicator?
Benefits of Utilizing ADL Indicator
When analyzing market breadth, incorporating the ADL indicator into your technical analysis toolkit offers invaluable insights into the dynamics of advancing and declining stocks.
The ADL indicator helps measure market breadth by tracking the cumulative difference between advancing and declining stocks, giving you a clear picture of market sentiment and trend health.
By monitoring the ADL line alongside price movements, you can gain insights into the underlying strength or weakness of a trend. This information is crucial for identifying potential trend reversals early on or confirming existing market trends.
Integrating the ADL indicator with other technical tools enhances your trading strategies, providing a more comprehensive understanding of market dynamics and improving your forecasting accuracy.
Strategies for Analyzing Market Breadth
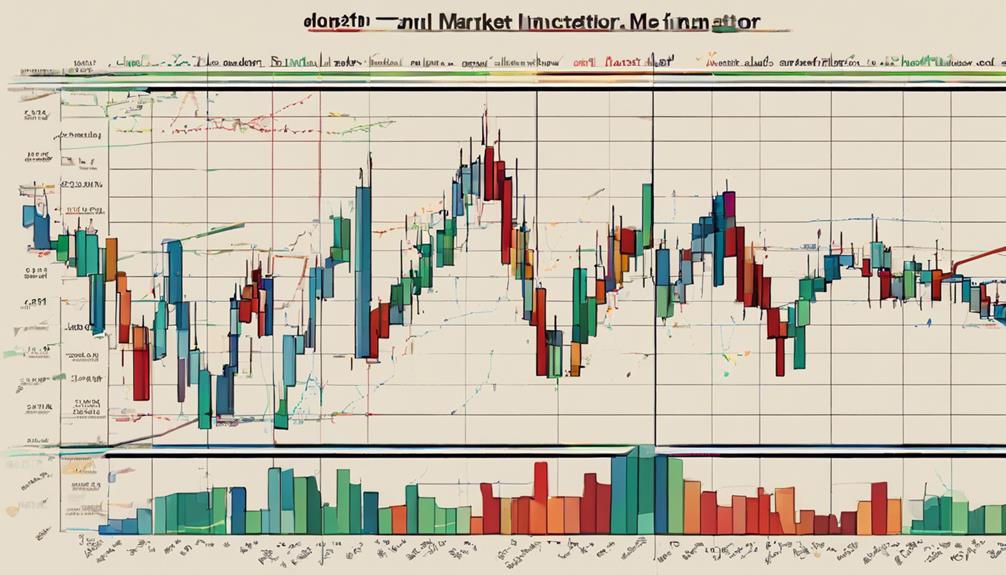
To effectively analyze market breadth, implementing strategic approaches that focus on interpreting the Advance-Decline Line (ADL) can provide crucial insights into market dynamics and trends. When the ADL is rising, it indicates bullish confirmation, reflecting a broad market uptrend with more advancing stocks. Conversely, a falling ADL suggests bearish signals, signaling a broader market downtrend with more declining stocks.
Identifying potential trend reversals becomes possible by observing divergences between the ADL and price movements. To deepen understanding, combine the ADL with other technical indicators to enhance trading strategies and gain a comprehensive view of market conditions. By incorporating these strategies into your analysis, you can gain valuable insights into market breadth and make informed decisions in your trading approach.
Understanding ADL Signals and Patterns
Understanding ADL signals and patterns reveals crucial insights into market dynamics and trends. When the ADL line trends upwards over time, it signals rising market breadth.
Patterns of divergence between the ADL line and the price chart can indicate potential market reversals. Confirm bullish trends by observing the ADL line moving in the same direction as the price chart.
Conversely, bearish sentiment is identified when the ADL line diverges downwards from the price chart. Keep an eye out for ADL crossovers with price movements as they can generate trading signals for investors.
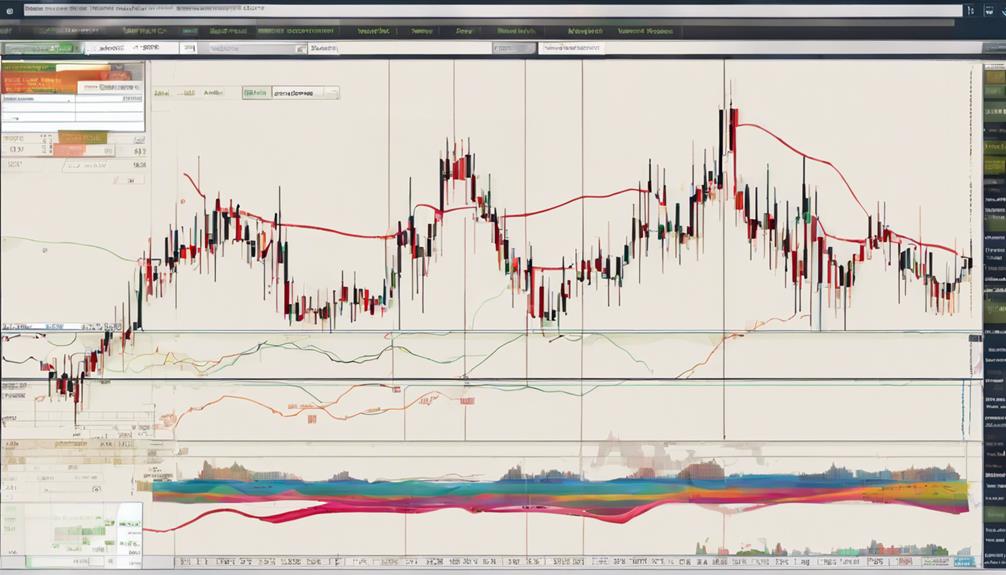
Enhancing Technical Analysis With ADL
Enhancing technical analysis with ADL involves tracking the cumulative sum of daily advancing versus declining stocks, providing valuable insights into market breadth trends and sentiment. By comparing the ADL line movement with price movements, traders can confirm market trends and detect potential reversals.
Integrating ADL with other technical indicators enhances the efficiency of trading strategies, offering a more comprehensive view of market dynamics. This approach enables traders to make informed decisions based on a deeper understanding of market breadth and sentiment.
ADL not only complements traditional technical analysis but also adds a layer of depth to forecasting price movements and identifying potential entry or exit points in the market.
How Can Market Breadth Techniques Like ADL Benefit Traders?
Market breadth techniques like ADL can benefit traders by providing a comprehensive view of the market’s health. By analyzing the ADL indicator, traders can gauge the strength of a trend and identify potential trend reversals. This can lead to more informed trading decisions and potentially higher profits, benefits of ADL explained.
How Can I Use ADL to Grasp Market Breadth?
When analyzing market breadth, leveraging the top benefits of ADL can be highly advantageous. By using the Accumulation Distribution Line, investors can gauge the strength of a trend and identify potential trend reversals. This can provide valuable insights and help make more informed trading decisions.
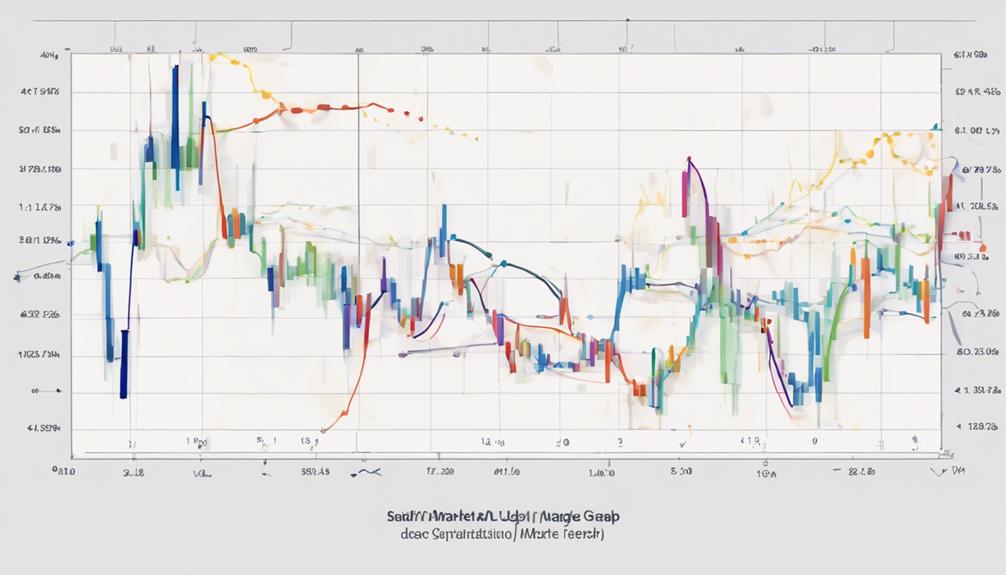
Leveraging ADL for Forecasting Accuracy

Leveraging the Advance-Decline Line (ADL) can significantly enhance the accuracy of market forecasting. Here are three key ways to optimize ADL for improved forecasting:
- Monitor Market Direction: ADL tracks the net difference between advancing and declining stocks, offering insights into market momentum and trend direction.
- Identify Divergence: Divergence between ADL and price charts can indicate potential market reversals or corrections, aiding in timely decision-making.
- Enhance Trading Strategies: Integrating ADL with market breadth indicators like the McClellan Oscillator can refine forecasting accuracy and optimize trading strategies for better outcomes.
Frequently Asked Questions
What Is the Best Market Breadth Indicator?
The best market breadth indicator is the Advance-Decline Line (ADL). It tracks advancing and declining stocks, providing insights into market direction and potential divergences. Understand ADL to analyze breadth and trends for informed trading decisions.
How Do You Determine Market Breadth?
To determine market breadth, assess the net difference between advancing and declining stocks. Utilize tools like the Advance-Decline Line (ADL) to track cumulative daily movements. A rising ADL signals positive breadth and bullish sentiment, while a falling ADL indicates negativity.
What Is the Best Indicator for Day Trading?
To master day trading, focus on the Relative Strength Index (RSI). It gauges overbought or oversold conditions, aiding in timing trades. Combine RSI with volume analysis for a comprehensive approach to market analysis.
What Is the Best Indicator for a Ranging Market?
In a ranging market, rely on the Advance-Decline Line (ADL) to gauge market breadth effectively. ADL tracks advancing and declining stocks, revealing market sentiment. Use ADL to spot reversals, confirm trends, and assess price movement strength.
Conclusion
By mastering the Advance-Decline Line (ADL) indicator, you can gain valuable insights into market breadth and make more informed trading decisions. Utilizing the ADL to confirm trends, identify reversals, and generate signals can greatly enhance your technical analysis skills.
Remember to integrate the ADL with other indicators for a more comprehensive market analysis. With these strategies in place, you can increase your forecasting accuracy and stay ahead in the ever-changing world of trading.