
As you navigate the intricate landscape of day trading moving averages, envision yourself deciphering market trends with precision akin to a skilled navigator charting a course through turbulent waters.
From understanding the nuances of different moving averages to mastering the art of combining indicators for optimal results, each insight unravels a layer of complexity in the realm of day trading strategies.
Stay tuned to uncover the secrets that could potentially revolutionize your approach to trading in ways you never thought possible.
Types of Moving Averages
Simple Moving Average (SMA) is a foundational indicator in day trading that calculates the average price over a specific period, providing a smooth trend line.
On the other hand, Exponential Moving Average (EMA) gives more weight to recent prices, making it more responsive to current market conditions.
While SMA equally weighs all data points within the chosen period, EMA adjusts more rapidly to price changes due to its focus on recent prices. This responsiveness can help traders identify potential trend changes earlier.
Understanding the difference between SMA and EMA is crucial for day traders looking to interpret market trends accurately and make informed trading decisions based on the most relevant price data available.
Importance of Moving Averages
Moving averages are crucial in day trading as they help you analyze trend direction and identify key support and resistance levels. By smoothing out price data, moving averages offer a clearer picture of market trends, aiding in decision-making processes.
Day traders commonly rely on moving averages like the 5, 8, and 13-bar SMAs to interpret market movements and generate trading signals.
Analyzing Trend Direction
In day trading, the analysis of trend direction through moving averages plays a crucial role in identifying potential market movements. When assessing trend direction with moving averages, consider the following:
- Smoothed Price Fluctuations: Moving averages help smooth out price fluctuations over a specified period, providing a clearer trend direction.
- Dynamic Support and Resistance: They act as dynamic support and resistance levels, signaling potential trend reversals or continuations.
- Crossover Signals: Different moving average combinations, such as the 5, 8, and 13-bar SMAs, can indicate bullish or bearish trends based on their crossovers.
Identifying Support and Resistance
Analyzing trend direction with moving averages in day trading is pivotal for traders to effectively identify support and resistance levels, guiding their decisions on potential price reversal points and trade entries.
Moving averages act as dynamic support and resistance levels, smoothing out price fluctuations to highlight crucial points on a chart. By utilizing moving averages, traders can pinpoint potential reversals and strategically plan their trading strategies.
These levels play a significant role in determining entry and exit points for trades, helping traders set up stop-loss and take-profit orders effectively. Understanding support and resistance levels through moving averages is essential for implementing successful day trading strategies and maximizing profit potential in the market.
Utilizing Moving Averages for Entry and Exit
When considering entry and exit points in day trading, utilizing moving averages can provide valuable insights into market trends and potential trading opportunities. Day traders often rely on specific moving average strategies to make informed decisions.
Here are three key ways moving averages can be used for entry and exit points:
- 20 EMA Signals**: The 20 Exponential Moving Average (EMA) can offer clear indications for entering and exiting trades swiftly.
- 5-8-13 Strategy: This moving averages combination is effective for identifying both trend reversals and continuations, aiding in timely trading decisions.
- 13-26 Confirmation**: Using the 13-26 moving average combination can help confirm trend directions, assisting in strategic entries and exits.
Trend Identification With Moving Averages
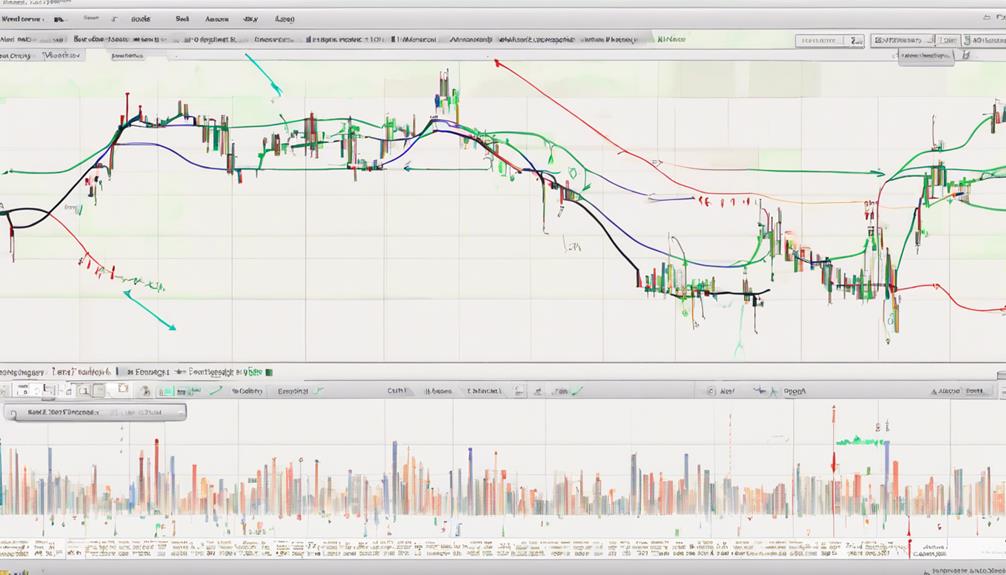
By examining the behavior of moving averages, day traders can effectively pinpoint and interpret market trends for strategic decision-making. Moving averages act as dynamic support and resistance levels, providing vital clues about the direction of the trend.
In day trading, utilizing the 5, 8, and 13-bar simple moving averages is common for trend identification. These moving averages help traders identify trends and potential entry/exit points.
Visual analysis of moving averages can also signal trend pauses, reversals, or continuations in the market. By incorporating multiple moving averages, traders can gain a clearer picture of the prevailing trend and make informed decisions based on the support and resistance levels provided by these indicators.
Golden and Death Cross Signals
When considering Golden and Death Cross signals, you should pay attention to how they confirm market trends. These signals can help you time entry and exit points effectively, enhancing your trading decisions.
Implementing risk management strategies based on these signals can optimize your overall trading performance.
Signal Interpretation Tips
To effectively interpret Golden and Death Cross signals in day trading, you must grasp their significance in indicating market trends and potential trading opportunities. Here are some tips to help you navigate these signals effectively:
- Golden Cross Signal: When the short-term moving average crosses above the long-term moving average, it signals a potential uptrend. This can be a sign of a bullish market trend and a potential buying opportunity.
- Death Cross Signal: Conversely, when the short-term moving average crosses below the long-term moving average, it suggests a possible downtrend. This indicates a bearish market trend and a potential selling opportunity.
- Timing and Interpretation: Understanding the implications and timing of Golden and Death Cross signals can assist you in making well-informed decisions in your day trading strategies.
Timing Entry Points
Analyzing the timing entry points through Golden and Death Cross Signals provides traders with valuable insights into potential market trends and optimal trading opportunities.
The Golden Cross, signaling an uptrend, occurs when a short-term moving average crosses above a long-term moving average. Conversely, the Death Cross, indicating a possible downtrend, happens when a short-term moving average crosses below a long-term moving average.
By using these moving average crossovers, traders can time their entry and exit points more effectively. These signals are widely used for identifying trend reversals and confirming market directions.
Implementing Golden and Death Cross strategies can assist traders in capitalizing on significant price movements and making well-informed trading decisions.
Risk Management Strategies
Implementing risk management strategies based on Golden and Death Cross signals is crucial for enhancing day traders' ability to minimize losses and maximize profit potential. When utilizing moving averages to guide risk management decisions, consider the following:
- Identify Trend Reversals: Golden Cross signals indicate a shift towards a bullish trend, while Death Cross signals suggest a bearish trend. Understanding these signals can help you adjust your trading positions accordingly.
- Set Stop-Loss Orders: Place stop-loss orders based on the confirmation provided by Golden and Death Cross signals to limit potential losses in case the trade goes against the anticipated trend.
- Take Profit at Optimal Levels: Use the information from moving averages to determine suitable profit-taking levels, aligning with the expected trend direction indicated by Golden and Death Cross signals.
Mean Reversion Strategies With Moving Averages
Utilizing moving averages in mean reversion strategies facilitates the identification of price reversals towards historical averages in trading scenarios.
Traders often use moving averages to spot overbought or oversold conditions in the market, signaling potential opportunities for mean reversion trades.
Whether employing simple moving averages (SMAs) or exponential moving averages (EMAs), these indicators serve as dynamic levels of support and resistance for mean reversion trading strategies.
By combining mean reversion techniques with other technical indicators, traders can enhance the accuracy of their trading signals and improve overall effectiveness.
This approach allows for a more data-driven and analytical decision-making process when engaging in day trading activities, increasing the potential for successful trades based on historical price movements.
Moving Average Convergence Divergence (MACD) Insights
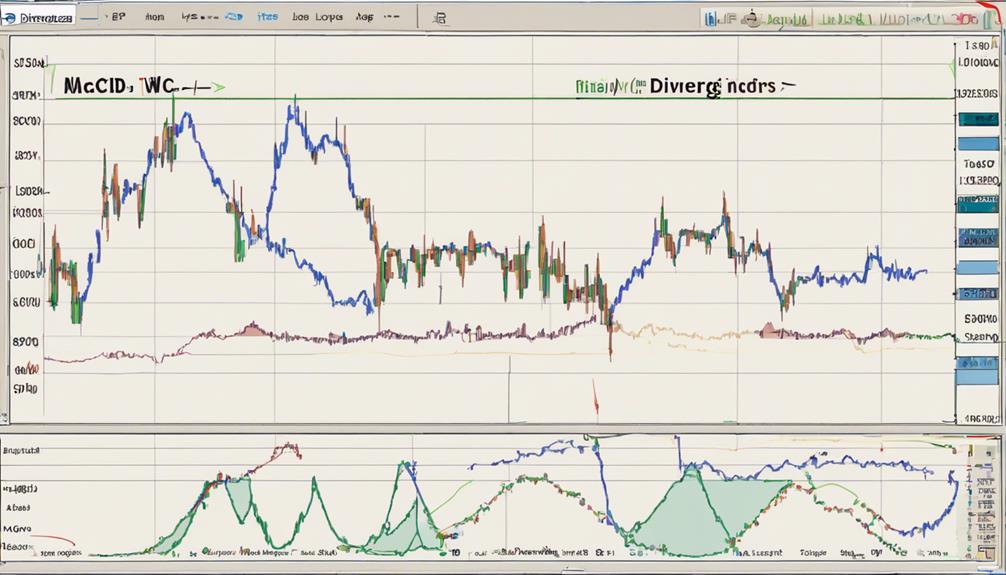
Moving from mean reversion strategies with moving averages, the focus now shifts to exploring insights into Moving Average Convergence Divergence (MACD).
When delving into MACD in day trading, consider the following insights:
- Trend Identification: MACD helps traders confirm the direction of a trend by analyzing the relationship between moving averages, aiding in understanding whether a security is in an uptrend or downtrend.
- Trend Reversals: MACD crossovers signal potential trend reversals, indicating shifts in market sentiment and offering traders opportunities to enter or exit positions.
- Trade Signal Generation: By interpreting the MACD histogram and its crossovers with the signal line, traders can generate buy or sell signals based on the momentum of a security's price movement.
Bollinger Bands in Day Trading
Bollinger Bands are a key tool in day trading, comprised of a middle band and upper and lower bands that adjust based on market volatility.
Traders utilize these bands to gauge potential overbought or oversold market conditions effectively.
Bollinger Bands Basics
When day trading, understanding the basics of Bollinger Bands is crucial for interpreting potential price movements. Bollinger Bands are a valuable tool due to their ability to adjust to market conditions.
Here are some key points to grasp:
- Bollinger Bands consist of three lines: a middle band (SMA), an upper band (SMA + 2 standard deviations), and a lower band (SMA – 2 standard deviations).
- The bands expand during high volatility and contract during low volatility, offering insights into potential price movements.
- Traders utilize Bollinger Bands to pinpoint overbought and oversold conditions, as prices typically revert to the mean within the bands.
Using Bands Effectively
Utilize Bollinger Bands effectively by incorporating them alongside other key indicators to enhance your day trading strategies and decision-making process.
Bollinger Bands consist of a middle band (SMA), upper band (SMA + 2 standard deviations), and lower band (SMA – 2 standard deviations), offering insight into market volatility. Wider bands indicate higher volatility, while narrower bands suggest lower volatility. Traders often interpret price touching or exceeding the outer bands as potential signals of overbought (upper band) or oversold (lower band) conditions.
Stochastic Oscillator Application
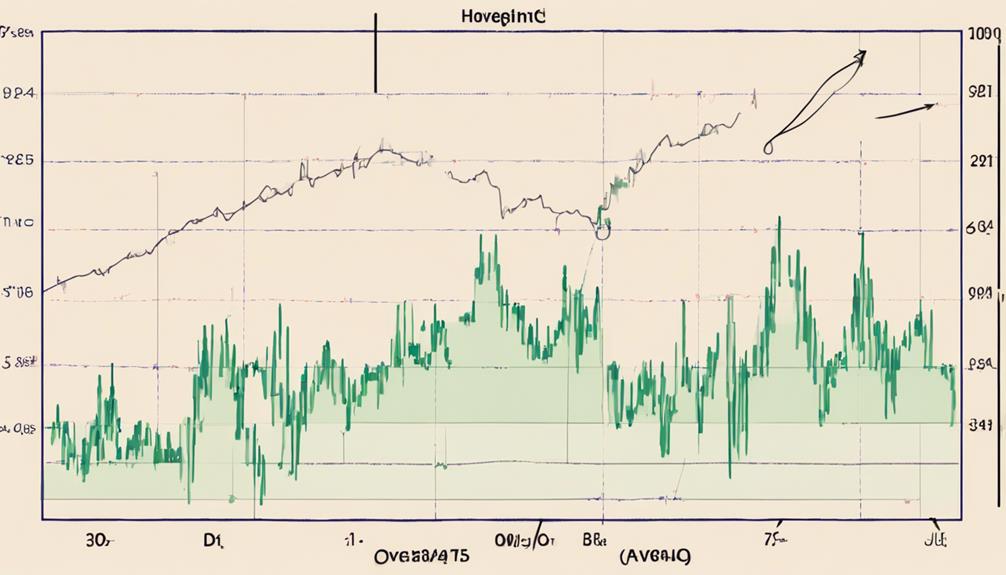
To effectively apply the Stochastic Oscillator in day trading, understanding its key components and interpretation is crucial for identifying potential market opportunities. The Stochastic Oscillator helps traders by indicating overbought conditions when the indicator is above 80 and oversold conditions when below 20. Here are some key points to keep in mind when utilizing the Stochastic Oscillator:
- The %K line is the primary oscillator line, reflecting the current closing price in relation to the price range.
- The %D line is a signal line that smooths the %K line using a moving average, providing insights into potential trend reversals.
- Traders often combine the Stochastic Oscillator with other indicators to validate trading signals and enhance decision-making processes.
How Can Day Traders Benefit from Using Moving Averages in Commodity Trading?
Day traders can benefit from commodity trading with moving averages by identifying trends and potential entry or exit points. Moving averages help smooth out price fluctuations, making it easier to spot trends and make informed trading decisions. By using moving averages, day traders can improve their chances of success in commodity trading.
Using Moving Averages With Other Indicators

You can enhance your day trading strategies by integrating moving averages with other indicators to validate signals and analyze market trends effectively.
Combining moving averages with indicators like the Relative Strength Index (RSI) can confirm market trends and validate trading signals. Additionally, using moving averages with the Moving Average Convergence Divergence (MACD) indicator enhances trend analysis and helps identify momentum shifts.
Integrating Bollinger Bands with moving averages aids in determining price volatility levels and potential reversal points in the market. By pairing moving averages with the MACD and Bollinger Bands, you can gain a more comprehensive understanding of market movements and make informed trading decisions based on a combination of indicators.
How Can Day Traders Utilize Moving Averages for Profitable Trading?
Day traders can use essential moving averages for profitable trading by identifying trends and potential entry and exit points. By analyzing short-term and long-term moving averages, traders can make informed decisions and increase their chances of success in the volatile stock market.
Frequently Asked Questions
What Is the 5 10 20 EMA Strategy?
The 5 10 20 EMA strategy combines three moving averages to identify trend changes and entry/exit points. It uses shorter EMAs for short-term trends and longer EMAs for longer-term trends, helping traders capture market momentum.
What Is the 10-Day Moving Average Strategy?
To implement the 10-day moving average strategy, calculate the average closing price of an asset over the past 10 trading days. This method helps smooth price fluctuations, aiding in trend identification and decision-making for day trading.
What Is the Most Popular Moving Average for Day Trading?
When day trading, the Simple Moving Average (SMA) is the go-to choice for many traders. Its ease of use and effectiveness in smoothing price data make it a reliable tool for identifying trends and entry/exit points.
What Is the Moving Average for Day Traders?
For day traders, the moving average serves as a trend-following indicator that smooths out price data to reveal the trend's direction. It provides a visual representation of the average price over a specific period, aiding in spotting entry and exit points.
Conclusion
Congratulations on mastering the top 10 insights into day trading moving averages!
Just like a skilled artist uses different brushes to create a masterpiece, you have learned to use various types of moving averages to paint a picture of profitable trades.
Keep honing your skills, experimenting with different strategies, and combining moving averages with other indicators to create your own unique trading style.
The market is your canvas, so go ahead and make some beautiful trades!