
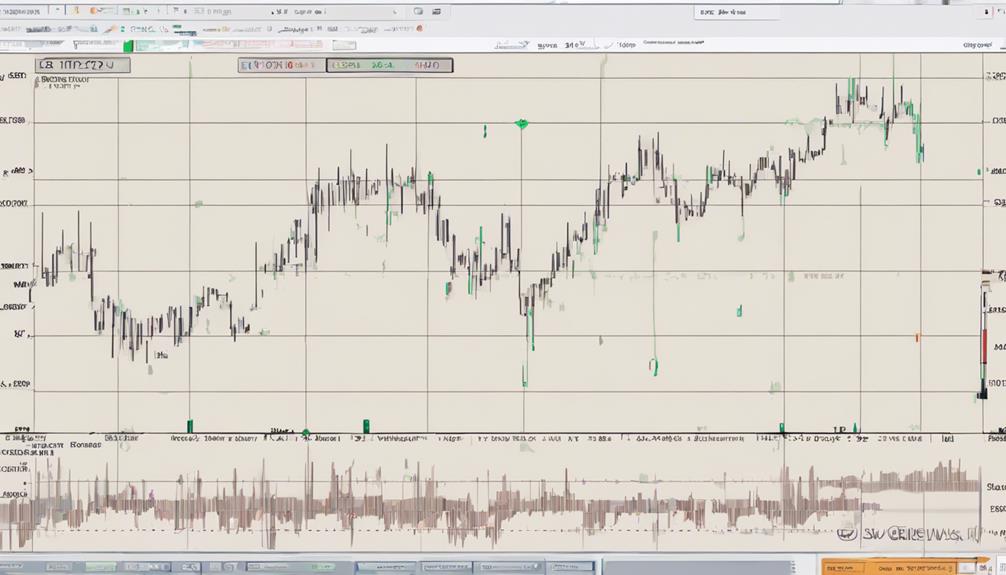
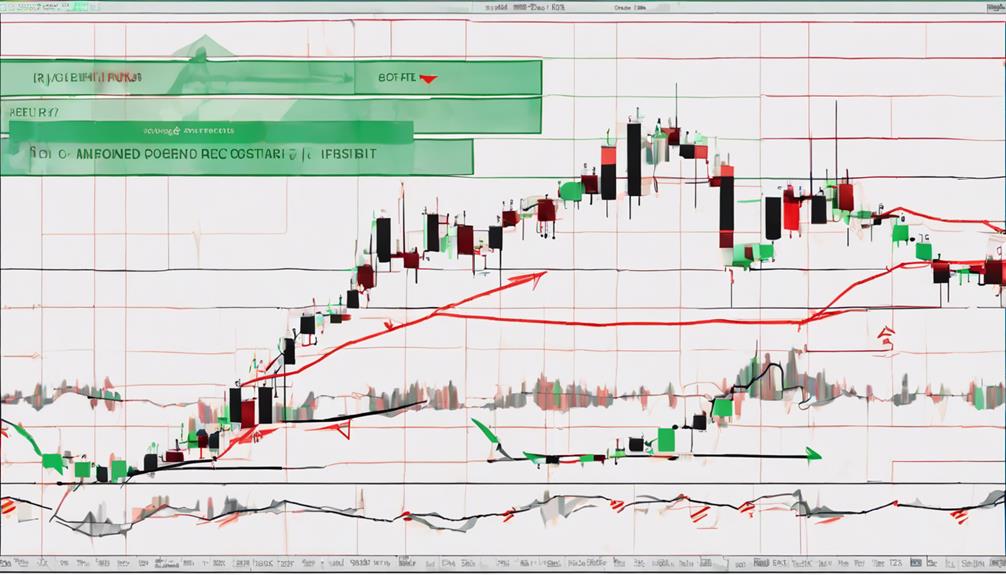
Navigating RSI overbought and oversold zones can seem like a daunting task, with crucial decisions hinging on these key levels. Understanding how to interpret these zones can be the difference between profitable trades and costly mistakes.
By mastering the art of identifying overbought conditions and recognizing oversold signals, you can gain a significant edge in your trading endeavors. Stay tuned to discover essential tips that will help you navigate these critical zones with confidence and precision.
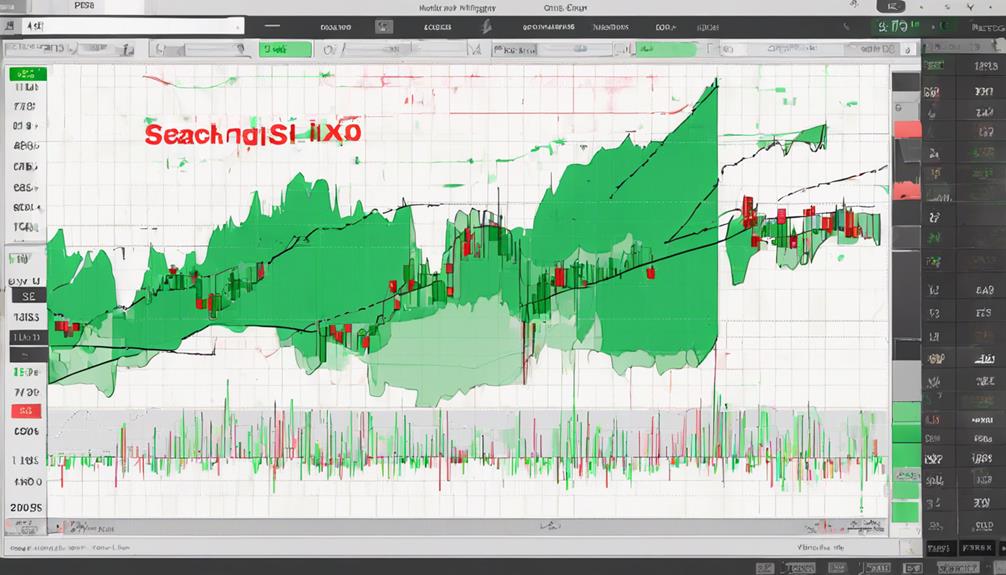
Identifying Overbought Conditions
Identifying overbought conditions in the Relative Strength Index (RSI) involves monitoring when the RSI value rises above 70, signaling potential overvaluation and indicating a probable price correction. This situation presents traders with a crucial decision point where taking profits or selling positions could be considered.
The RSI value breaching 70 suggests that the asset may be overvalued, potentially leading to a price correction. Different assets exhibit varying levels of volatility, with some considering RSI levels above 80 as extreme overbought conditions.
Recognizing these overbought signals assists traders in evaluating potential selling opportunities and managing their positions effectively. By understanding these conditions, traders can make informed decisions regarding their investments and capitalize on market movements for optimal results.
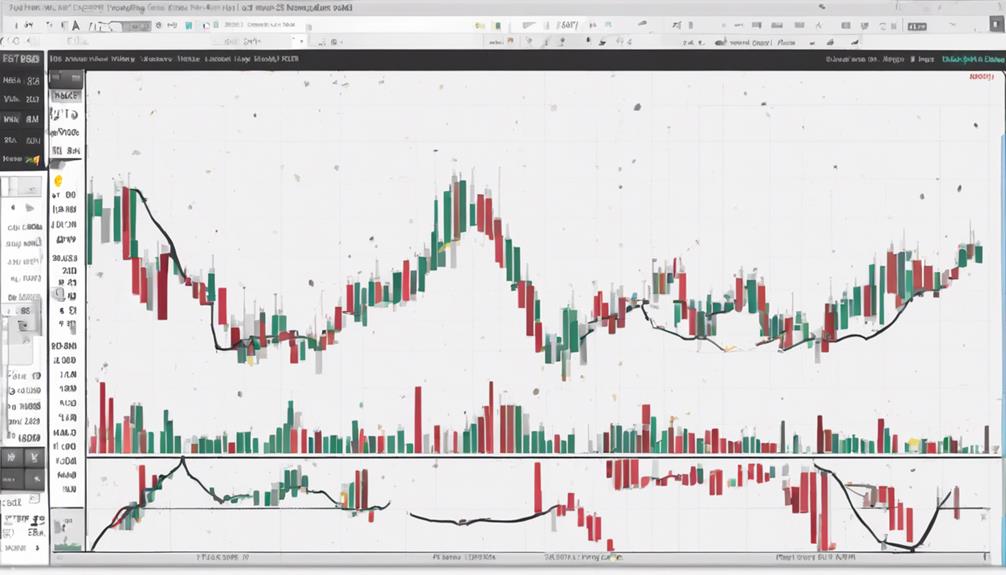
Recognizing Oversold Signals
When considering market conditions and evaluating potential trading opportunities, recognizing oversold signals in the Relative Strength Index (RSI) below the 30 threshold is crucial for informed decision-making. An RSI value below 30 typically indicates an oversold condition in the market, presenting opportunities for traders to buy assets.
These oversold signals suggest that selling pressure may have exhausted, potentially signaling a price reversal. To strengthen trading decisions based on oversold signals, confirmation from other technical indicators is advisable. It's essential to monitor price action alongside RSI to validate oversold signals accurately.
Incorporating oversold signals into your RSI Trading Strategy can enhance your ability to identify favorable entry points and make well-informed trading decisions.
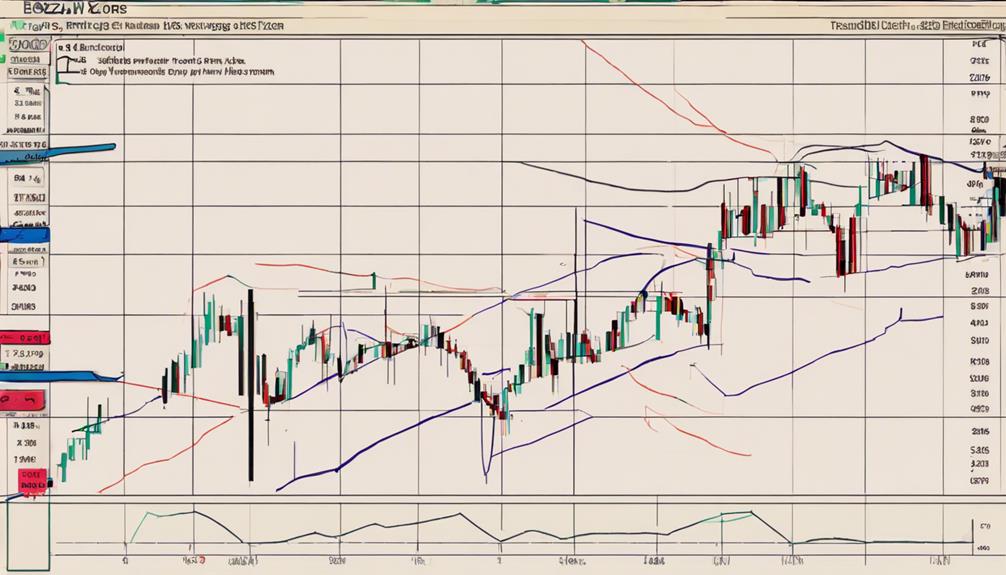
Understanding RSI Thresholds
To grasp the significance of RSI thresholds in trading, understanding their role in pinpointing potential market reversals is essential. RSI thresholds are typically set at 70 for overbought conditions and 30 for oversold conditions.
When the RSI crosses above 70, it indicates that the asset may be overbought and could be due for a correction. Conversely, if the RSI drops below 30, it suggests that the asset may be oversold and potentially undervalued.
Navigating Overbought Markets
When facing overbought markets, understanding the indicators is crucial. Managing risk effectively and timing your entry and exit points can be challenging in such conditions.
Identifying overbought signals and utilizing them strategically can help you navigate these markets with confidence.
Overbought Indicators Explained
Navigating overbought markets involves understanding the implications of RSI values exceeding 70, indicating potential selling opportunities and upcoming price corrections. When the RSI value surpasses 70 in overbought zones, it serves as a warning sign that a strong uptrend may be nearing exhaustion. Traders should exercise caution during these times as it could signal a forthcoming price correction.
In overbought conditions, considering profit-taking or opening short positions may be prudent strategies. Monitoring RSI levels above 70 helps traders anticipate potential trend reversals and manage risk effectively. By recognizing these overbought indicators and their significance, traders can make informed decisions to navigate such market conditions with more confidence.
Managing Risk Effectively
Implementing proper risk management strategies is essential when navigating overbought markets to safeguard against potential losses and capitalize on profit opportunities.
Utilize stop-loss orders to limit downside risk and consider employing trailing stops to secure profits in volatile conditions.
Diversifying your portfolio can help spread risk exposure and reduce the impact of market corrections.
Incorporating moving averages in your technical analysis can assist in confirming overbought signals and making well-informed trading decisions.
Stay updated with market news to proactively manage risks associated with overbought conditions.
Timing Entry and Exit
To optimize your trading strategy in overbought markets, precision in timing your entry and exit points is crucial for capitalizing on potential price corrections. When navigating overbought markets, consider the following strategies:
- Look for bearish divergences or price action indicating a trend reversal.
- Implement tight stop-loss orders to manage risk effectively.
- Utilize trailing stop orders to lock in profits as the market potentially reverses.
- Monitor volume trends and market sentiment alongside RSI readings to validate overbought signals for strategic exits.
Managing Oversold Market Conditions

During oversold market conditions, identifying assets with RSI values below 30 can signal potential buying opportunities for traders seeking reversals and undervalued assets. Traders can look for stocks or assets with RSI readings indicating oversold levels, suggesting a possible price increase ahead.
This RSI strategy is particularly attractive to contrarian traders aiming to capitalize on discounted prices in the market. By monitoring RSI levels below 30 in oversold zones, traders can pinpoint potential entry points for profitable trades.
The RSI indicator serves as a valuable tool in highlighting these opportunities within the market. Utilizing RSI signals in oversold conditions can aid traders in making informed decisions when seeking undervalued assets with potential for upward movement.
Utilizing RSI Divergence
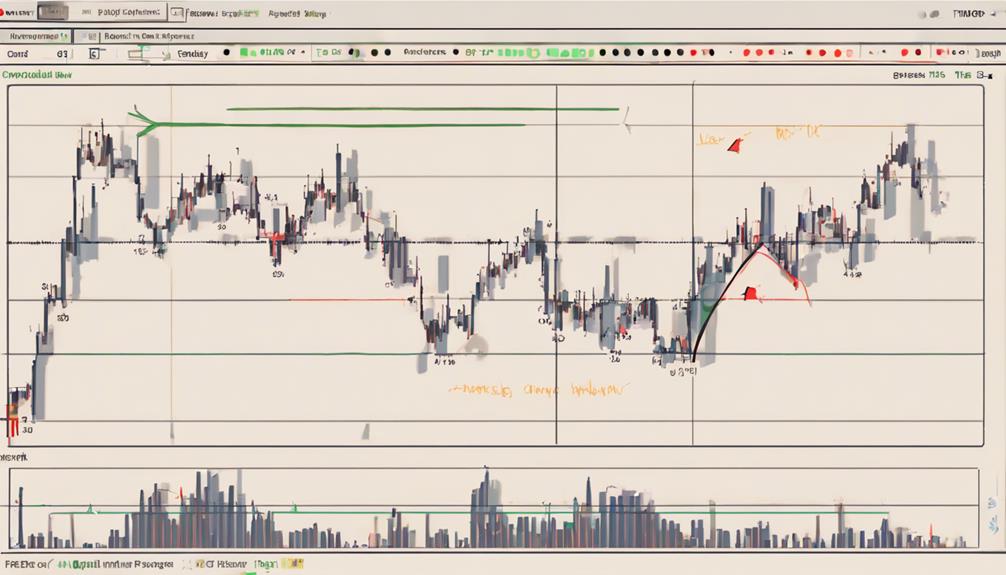
In utilizing RSI divergence, traders can effectively pinpoint potential trend reversals by analyzing price movements against RSI readings. When dealing with RSI divergence, keep in mind the following:
- Bullish divergence: Prices make new lows while RSI forms higher lows, signaling possible upward price movement.
- Bearish divergence: Prices make new highs while RSI forms lower highs, indicating potential downward price movement.
- Confirm trend changes: RSI divergence is a powerful tool to confirm shifts in trends.
- Trading opportunities: Recognizing RSI divergence can present valuable trading opportunities in dynamic markets.
Interpreting RSI divergence accurately allows traders to make informed decisions based on the analysis of price movements and RSI readings.
Reacting to Overbought Signals

When RSI values surge above 70, it signals potential overbought conditions in the market. Selling positions in response to these signals can help you capture gains from potential price corrections.
Overbought Warning Signs
Consider potential selling opportunities in the market when the Relative Strength Index (RSI) values rise above 70, indicating overbought conditions. When faced with overbought signals, here are some warning signs to keep in mind:
- RSI values above 70 signal potential price correction.
- Traders view overbought conditions as selling opportunities.
- Overbought zones may result in price reversals or consolidation.
- High RSI levels above 70 could indicate trend exhaustion.
These signs serve as a cautionary reminder for traders to adjust their positions thoughtfully in response to overbought signals. Being aware of these warning signs can help in navigating market fluctuations efficiently.
Timing Entry Points
Navigating overbought signals effectively requires strategic timing of entry points, particularly by waiting for the RSI to confirm these conditions and seeking validation through price confirmation.
When the RSI indicator surpasses 70, signaling an overbought market, it presents a potential selling opportunity. To time your entry accurately, consider using other technical indicators to validate the signal and avoid false entries.
By waiting for price confirmation alongside the RSI overbought signal, you can steer clear of premature selling decisions. A comprehensive approach that combines RSI analysis with price action and trend confirmation is crucial for successful navigation of overbought zones.
Responding to Oversold Indicators

In response to oversold indicators, traders often view an RSI below 30 as a potential buying opportunity. When the RSI falls below this threshold, it suggests oversold conditions in the market, indicating that selling pressure may have peaked.
Here are some key points to consider when responding to oversold RSI signals:
- An RSI below 30 may signify extreme conditions of overselling.
- Market entering the oversold zone could lead to a potential price reversal.
- Combining oversold RSI signals with other technical indicators can provide trade confirmation.
- Traders often use oversold RSI levels as a cue to consider initiating buy positions.
Strategies for Overbought Zones
When encountering RSI values surpassing 70, traders often contemplate profit-taking or initiating short positions due to the indication of potentially overvalued assets in the overbought zone. Overbought conditions suggest a potential reversal or correction in the price, highlighting a selling opportunity.
Monitoring RSI levels above 70 helps traders identify when an asset may be reaching unsustainable price levels. To optimize trading strategies, combining RSI overbought signals with other technical indicators can enhance decision-making.
It's crucial to consider the broader market context and not rely solely on RSI readings for trading decisions in overbought conditions. By incorporating a comprehensive approach and understanding the nuances of overbought signals, traders can make informed choices when navigating the complexities of overvalued assets.
How Can I Use RSI Overbought and Oversold Zones in Conjunction with Bollinger Bands for Trading?
By using RSI overbought and oversold zones in conjunction with Bollinger Bands trading effectiveness can be enhanced. When RSI indicates overbought or oversold conditions and Bollinger Bands confirm the trend, it can signal potential trading opportunities. This combination can help traders make more informed decisions.
Techniques for Oversold Zones
After identifying overbought conditions in the market, traders can shift their focus towards implementing effective techniques for navigating oversold zones to capitalize on potential buying opportunities. When dealing with oversold conditions indicated by RSI values below 30, consider the following strategies:
- Look for assets in oversold conditions to benefit from potential price reversals and undervalued positions.
- Use oversold zones as signals for possible rebounds in asset prices.
- Pinpoint entry points for long positions by monitoring RSI levels below 30.
- Enhance trading strategies and decision-making accuracy by combining oversold signals with other technical indicators.
Frequently Asked Questions
What Are the Best Indicators for Overbought and Oversold?
You can identify overbought and oversold conditions using the Relative Strength Index (RSI). RSI levels above 70 suggest overbought zones, while levels below 30 indicate oversold areas. Combining RSI with other indicators can enhance your trading decisions.
What Is the RSI 30 70 Strategy?
The RSI 30 70 strategy involves monitoring RSI levels above 70 (overbought) and below 30 (oversold). Use it to spot potential reversals in price movements. Above 70 suggests selling, below 30 indicates buying opportunities.
What Is the RSI 3 Period Strategy?
When trading with the RSI 3 period strategy, you'll notice its quick signals for overbought and oversold conditions. Stay vigilant for increased market noise and false signals. Manage risks carefully and seek confirmation from other indicators for informed decisions.
What Is the 5 Star RSI Strategy?
When utilizing the 5 Star RSI Strategy, you'll enhance your trading signals by combining RSI with other indicators. This approach focuses on pinpointing ideal entry and exit points, filtering out false signals, and boosting trade accuracy.
Conclusion
In conclusion, mastering RSI overbought and oversold zones is a critical skill for traders. By understanding key thresholds, recognizing signals, and implementing strategic techniques, you can navigate volatile markets with confidence.
Remember, RSI is just one tool in your arsenal, so combine it with other indicators for a comprehensive analysis. With practice and perseverance, you'll soon be adept at navigating these zones and making informed trading decisions.
Keep honing your skills and watch your success soar!