
In the realm of swing trading, the significance of volatility indicators cannot be overstated. While various indicators hold value, some are deemed essential for informed decision-making in this trading style. Bollinger Bands stand out as a critical tool for swing traders due to their ability to gauge price volatility and signal potential overbought or oversold conditions.
However, this is just the beginning of the discussion on essential volatility indicators for swing trading. Other indicators like Average True Range (ATR) and volatility stop indicators also merit consideration when navigating the complexities of the market.
Importance of Volatility Indicators in Trading
Why are volatility indicators essential tools for traders navigating the dynamics of swing trading?
Volatility indicators such as Bollinger Bands, Average True Range (ATR), and Keltner Channels play a crucial role in helping traders assess the level of price fluctuations within the market. These indicators offer valuable insights into market uncertainty, risk levels, and potential profit opportunities, enabling traders to make informed decisions regarding stop-loss levels and entry/exit points.
By utilizing volatility indicators effectively, traders can better understand the underlying trends and movements in the market, thereby enhancing their ability to manage risk and optimize their trading strategies. In the realm of swing trading, where timing and precision are key, volatility indicators serve as essential instruments for traders to navigate the complexities of the market landscape.
With the aid of these tools, traders can more accurately gauge market conditions, identify optimal trading opportunities, and establish effective risk management strategies to drive success in their trading endeavors.
Understanding Bollinger Bands for Volatility
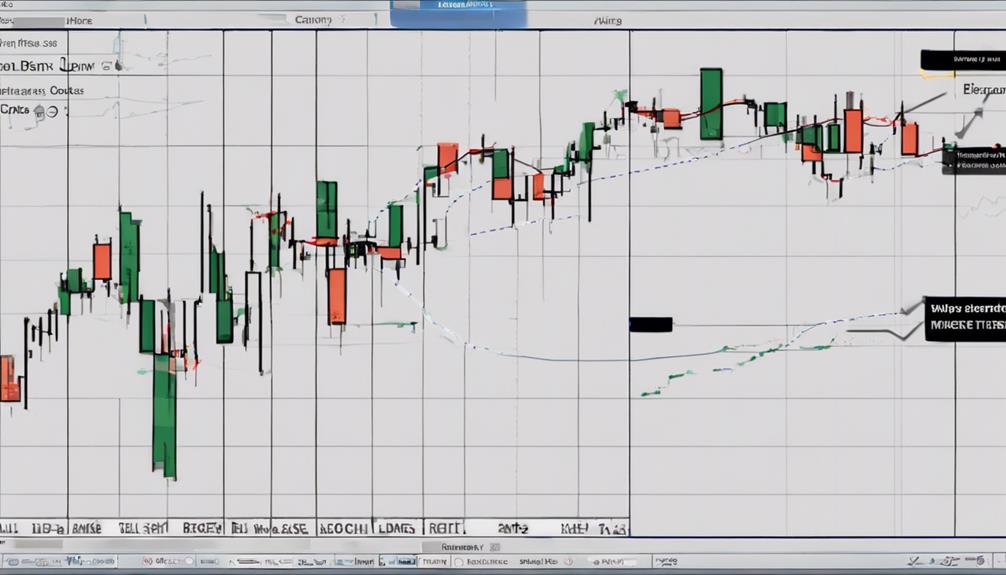
Bollinger Bands, a technical analysis tool comprising upper, lower, and middle bands based on price volatility, are instrumental in assessing market dynamics for swing traders. The middle band, typically a 20-day simple moving average, acts as a baseline for price movements. These bands expand and contract in response to market volatility, offering insights into potential overbought or oversold conditions.
Traders utilize Bollinger Bands to visualize price volatility, identify reversal points, and effectively set stop-loss levels. The upper band represents the statistical measure of high prices, while the lower band indicates low prices. By observing the width between the bands, traders can gauge market volatility levels.
Understanding Bollinger Bands aids swing traders in recognizing price range movements and making informed decisions based on the band's interactions with price action. Their versatility in highlighting potential entry and exit points makes them a valuable tool in navigating the complexities of swing trading.
Utilizing Average True Range (ATR)
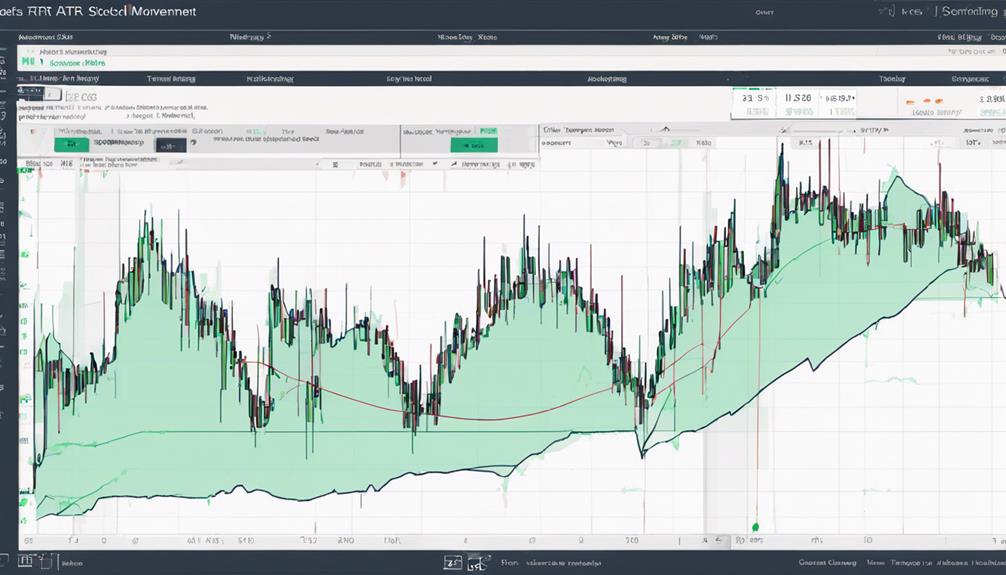
Utilizing Average True Range (ATR) in swing trading enhances traders' ability to gauge market volatility levels and make well-informed decisions based on calculated price ranges. When incorporating ATR into trading strategies, traders benefit from:
- Measuring Market Volatility: ATR calculates the asset's volatility by determining the average price range over a specific period. This information is crucial for understanding the market's behavior and potential price movements.
- Setting Stop-Loss Levels: ATR assists traders in establishing appropriate stop-loss levels based on the asset's volatility. By considering the calculated price ranges, traders can effectively manage risk and protect their positions.
- Determining Potential Price Fluctuations: ATR values can be expressed in points or percentages, providing traders with valuable insights into potential price fluctuations. This aids in making informed decisions regarding entry and exit points in swing trading scenarios.
Impact of Volatility on Swing Trading
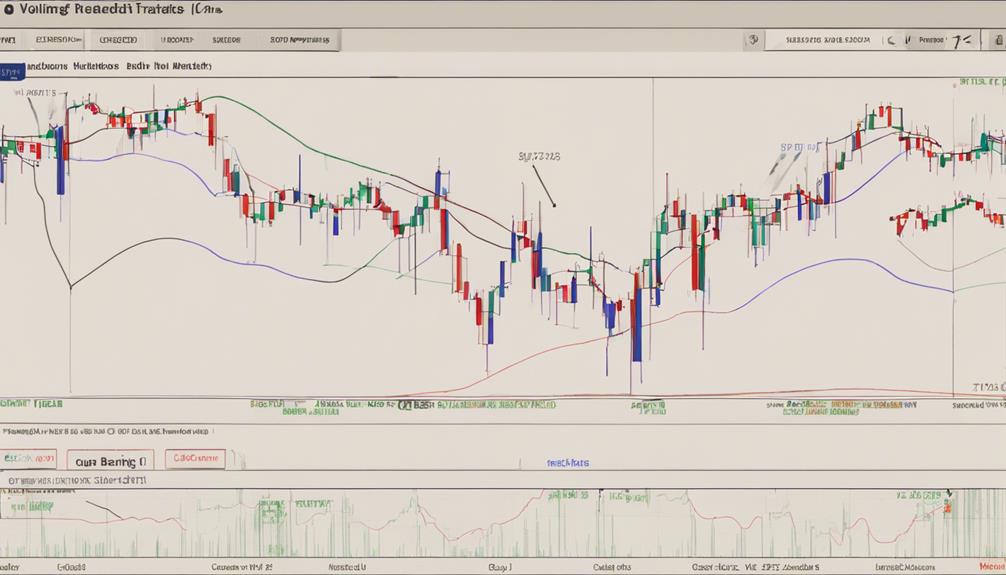
The impact of volatility on swing trading can significantly influence traders' risk exposure and profit potential within a specific timeframe. Volatility indicators such as Bollinger Bands and Average True Range (ATR) play a crucial role in helping traders navigate the price fluctuation dynamics.
High volatility levels may offer increased profit potential, but they also elevate the risk exposure associated with swing trading. Understanding how to interpret these volatility indicators is essential for identifying potential trend reversals and setting appropriate stop-loss levels based on market volatility.
Incorporating Volatility Stop Indicators
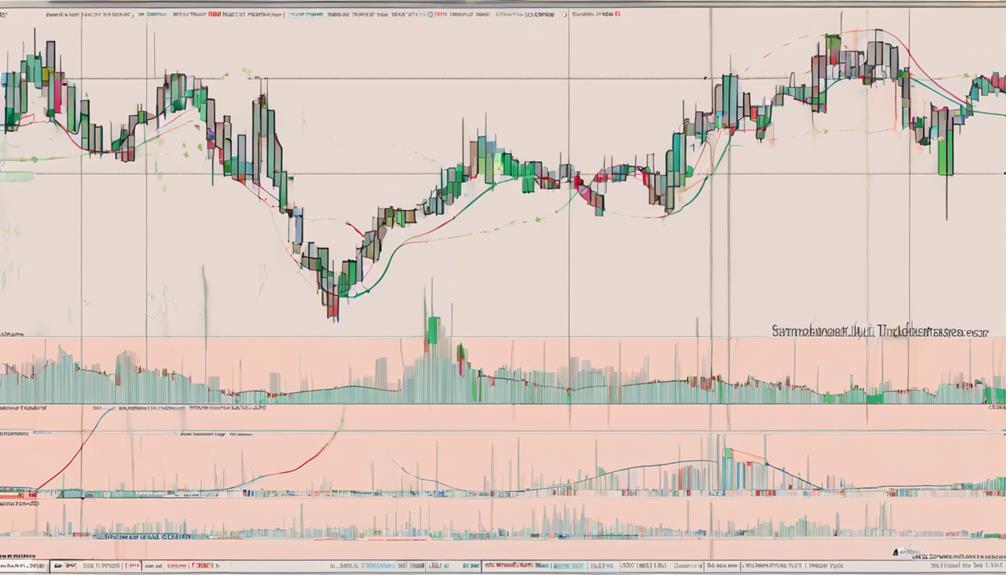
Incorporating volatility stop indicators into swing trading strategies enhances risk management by dynamically adjusting stop-loss levels based on market fluctuations and the average true range (ATR). When implementing these indicators, traders benefit from:
- Dynamic Stop-Loss Levels:
Volatility stop indicators help set dynamic stop-loss levels that adapt to the changing market conditions, ensuring that trades are protected from sudden price movements.
- Risk Reduction:
By using volatility stop indicators that consider the average true range (ATR), traders can effectively reduce their exposure to risk by placing stop-loss orders at levels that align with the current market volatility.
- Protect Profits and Limit Losses:
These indicators not only help protect profits by locking in gains at optimal levels but also limit potential losses by adjusting stop levels according to the prevailing market volatility, thus safeguarding capital.
What are the Essential Volatility Indicators for Swing Trading?
When it comes to swing trading, understanding the key volatility indicators in trading is crucial. The Average True Range (ATR), Bollinger Bands, and the Volatility Index (VIX) are all essential for gauging market volatility and making informed trading decisions. These indicators help traders identify potential entry and exit points with greater accuracy.
Frequently Asked Questions
What Is the Best Volatility for Swing Trading?
The best volatility for swing trading depends on market conditions and risk tolerance. Traders often look for moderate volatility that allows for price movements without excessive risk. A balanced approach to volatility can enhance trading strategies.
What Are the Most Important Indicators for Swing Trading?
In navigating the complexities of swing trading, adept traders prioritize key indicators like Bollinger Bands and Average True Range for insightful market analysis. These tools offer invaluable insights into volatility, aiding in strategic decision-making.
What Analysis Is Best for Swing Trading?
In swing trading, technical analysis is paramount, focusing on price movements, volume, and statistical trends. Fundamental analysis can complement but isn't primary. Popular indicators like Stochastic, Williams %R, and RSI are leading indicators, while Moving Averages and MACD are lagging. Balancing both is crucial.
What Are the Essentials of Successful Swing Trading?
Mastering successful swing trading necessitates understanding market dynamics, utilizing technical tools, setting precise entry/exit points, and managing risks effectively. Adapting to market changes, continuous learning, and disciplined execution are vital for sustained profitability in swing trading.
Conclusion
In the realm of swing trading, volatility indicators like Bollinger Bands and Average True Range are essential tools for navigating the unpredictable waters of the market. By understanding and utilizing these indicators effectively, traders can better manage risk and seize potential opportunities within fluctuating markets.
Incorporating volatility stop indicators further enhances risk management strategies. In the ever-changing landscape of trading, embracing volatility indicators is akin to setting sail with a reliable compass, guiding traders through turbulent seas towards profitable shores.