
Have you ever wondered how Bollinger Bands can enhance your trading decisions?
Understanding the basics of Bollinger Bands is crucial for any beginner looking to grasp this powerful tool and its implications on market analysis.
By exploring the fundamentals of Bollinger Bands, you can unlock a world of potential strategies to optimize your trading performance.
Understanding Bollinger Bands
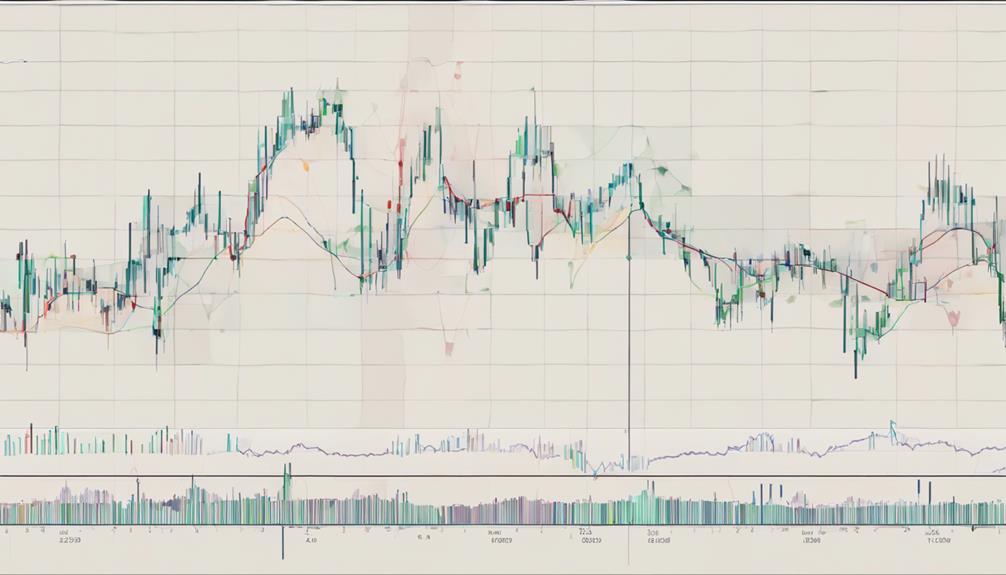
Understanding Bollinger Bands involves analyzing price movements within a framework of statistical channels that indicate potential market conditions. Bollinger Bands, a popular technical analysis tool, consist of a centerline represented by a moving average and upper and lower bands set at 2 standard deviations from the centerline.
These bands serve as dynamic support and resistance levels, helping traders gauge market volatility. When prices touch the bands, it can signal potential trading opportunities. Traders often interpret prices nearing the upper band as overbought and prices nearing the lower band as oversold.
Bollinger Bands don't forecast price direction but provide insights into market dynamics, guiding traders on possible entry and exit points based on price volatility.
Examples of Bollinger Bands
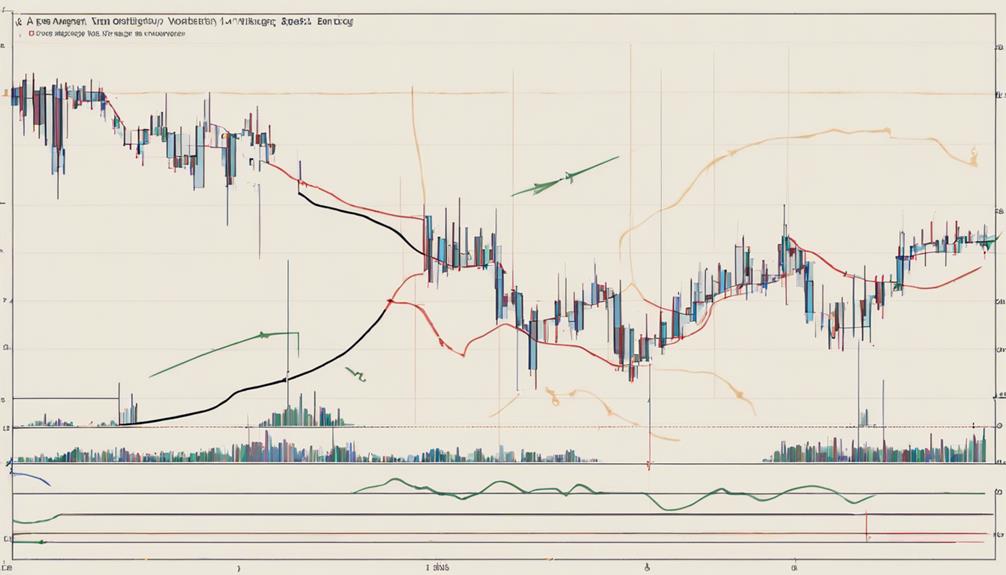
Analyzing real-world Examples of Bollinger Bands can provide practical insights into their application in trading scenarios. When the price touches the upper Bollinger Band, it indicates potentially overbought conditions, suggesting a sell signal. Conversely, touching the lower band implies oversold conditions, signaling a buy opportunity.
The bands expand and contract based on price volatility, reflecting potential price movements. Traders use Bollinger Bands to set price targets, identify trend reversals, and manage risk effectively. By understanding how the bands adjust to standard deviations of price movements, traders gain valuable information on market conditions and potential entry/exit points.
Incorporating Bollinger Bands into your trading strategy can help enhance decision-making and improve overall trading performance.
What Are Bollinger Bands
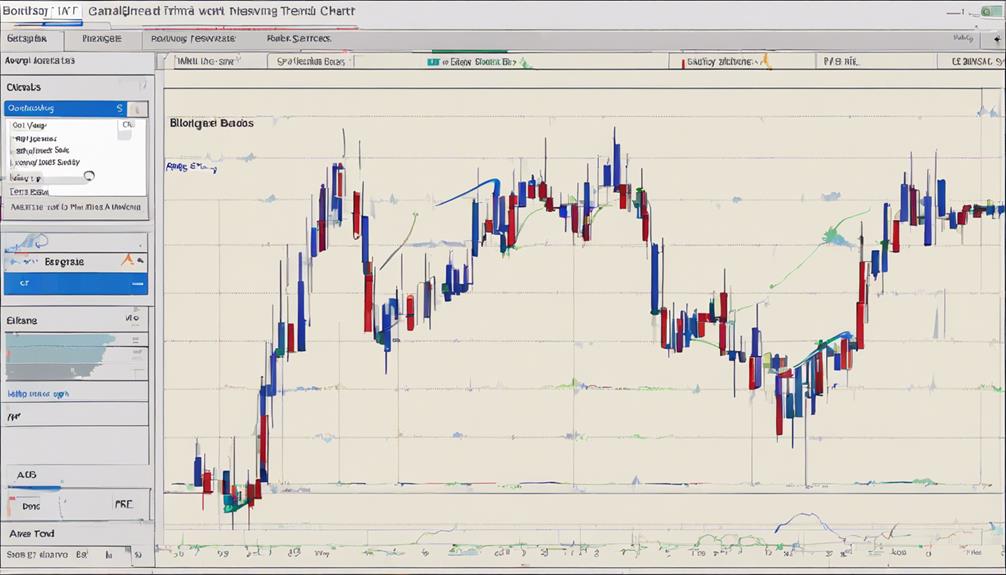
Bollinger Bands, developed by John Bollinger, serve as a technical tool to measure market volatility and identify overbought or oversold conditions. They consist of three lines: a middle line that's a simple moving average (SMA), and upper and lower bands that represent two standard deviations from the SMA. These bands adjust to market conditions, contracting in quiet times and expanding in volatile periods.
What Do Bollinger Bands Tell You
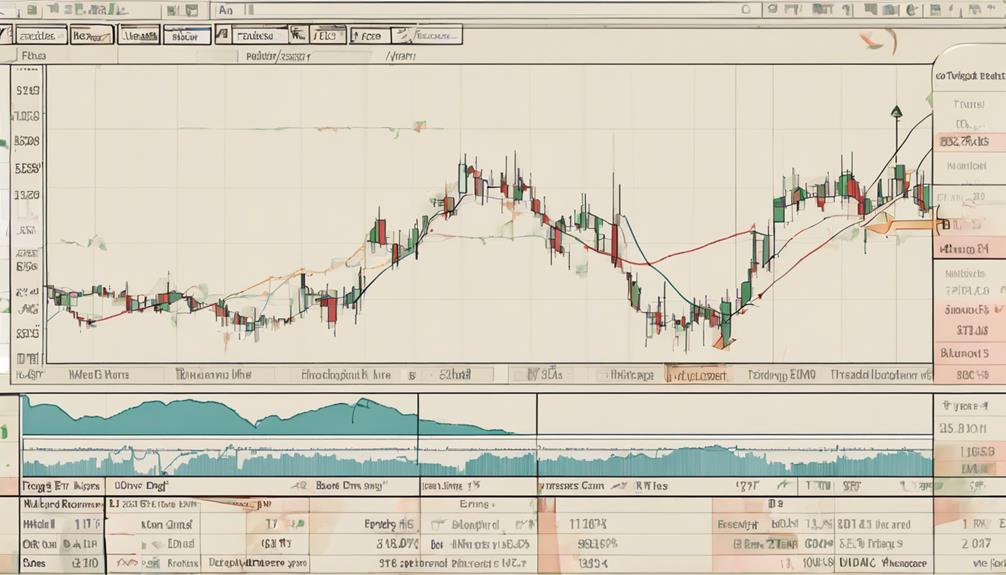
When price interacts with the upper or lower bands of Bollinger Bands, it provides valuable insights into market conditions. Bollinger Bands® Tell:
- Prices touch the lower band: Indicating potential oversold conditions and opportunities for profit.
- Upper band: Suggesting overbought market conditions based on price action.
- Moving average indicators developed: Bollinger Bands consist of a simple moving average and upper and lower bands set at a specified number of standard deviations from the SMA.
This setup helps traders take advantage of price volatility as the price continually touches the bands, signaling potential trading opportunities around the trend.
Can You Explain Bollinger Bands in a Beginner-Friendly Way?
Bollinger Bands are a tool used in technical analysis to measure volatility. The band consists of a simple moving average and two standard deviation lines. When the bands contract, it indicates low volatility, while expansion signals high volatility. Understanding Bollinger Bands explained is essential for traders to make informed investment decisions.
Could You Explain Bollinger Bands in a Simple Way for Beginners?
Bollinger Bands are a tool used in technical analysis to measure price volatility. The bands consist of a simple moving average and two standard deviations above and below it. They can help in understanding Bollinger Bands concept by showing when a market is overbought or oversold.
Limitations of Bollinger Bands
The reliability of Bollinger Bands as a standalone indicator can be compromised due to certain inherent limitations. False signals are common during choppy or non-trending market conditions. The arbitrary nature of the 20-day SMA and 2 standard deviations used in Bollinger Bands can limit accuracy.
To mitigate these issues, traders shouldn't solely rely on Bollinger Bands but also incorporate other indicators for confirmation. Bollinger Bands may not always provide clear signals on their own, necessitating additional analysis for better decision-making.
Utilizing other technical indicators like Donchian Channels and Keltner Channels can offer different perspectives on price movements compared to Bollinger Bands, enhancing overall market analysis.
Frequently Asked Questions
What Are Bollinger Bands for Dummies?
Bollinger Bands for dummies help simplify market analysis by visually representing price volatility and potential reversals. They consist of three lines – upper, middle, lower – adjusting to market conditions for insightful trading decisions.
What Is a Bollinger Band in Simple Terms?
When trading, you'll find Bollinger Bands useful to gauge market volatility. They highlight potential trading moments by showing when prices touch the bands. Remember, Bollinger Bands don't forecast price direction but can hint at market shifts.
How to Learn Bollinger Bands?
To learn Bollinger Bands, study price interactions with the bands, grasp how they expand or contract based on market volatility, and practice identifying overbought and oversold conditions for potential trading setups.
What Is the Rule of Bollinger Bands?
In trading, the rule of Bollinger Bands involves a moving average as a centerline with upper and lower bands indicating overbought or oversold conditions. Traders use these to plan entries and exits effectively.
Conclusion
You've learned the basics of Bollinger Bands, a valuable tool for traders. While they can indicate market conditions and potential trading opportunities, remember that they don't predict price movements.
By combining Bollinger Bands with other indicators, you can make more informed trading decisions. Keep in mind the limitations of Bollinger Bands and use them wisely to manage risk effectively in your trading strategy.
Trading success lies in understanding and utilizing these tools effectively.