
As traders navigate the intricate landscape of technical analysis, unlocking the potential of Keltner Channels emerges as a crucial skill set.
The intricate interplay between volatility and trend identification within these channels offers a nuanced perspective on market dynamics.
By peeling back the layers of this indicator, traders can uncover hidden patterns and strategic entry points that may have previously eluded them.
Embracing the complexities of Keltner Channels opens the door to a deeper understanding of market behavior and a more refined approach to decision-making.
Fundamentals of Keltner Channels
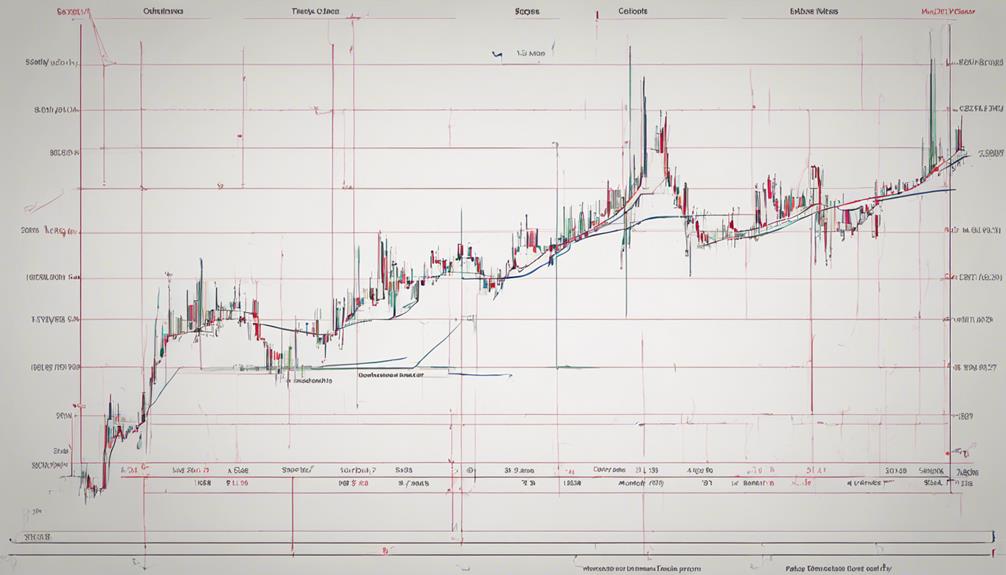
Exploring the foundational principles of Keltner Channels provides traders with a robust understanding of this volatility-based indicator's structure and utility in technical analysis. Keltner Channels are set around an exponential moving average (EMA) and are composed of upper and lower bands that adjust dynamically based on market volatility, incorporating the average true range (ATR).
These bands help traders identify trends, potential breakouts, and dynamic support and resistance levels in the market. By using the Keltner Channels, traders can visualize the ebb and flow of price movements within a specified range, aiding in trend analysis. The volatility-based nature of Keltner Channels allows traders to adapt to changing market conditions more effectively.
When prices touch or exceed the boundaries of the channels, traders interpret these events as potential signals for trading decisions, aiding in the identification of significant price movements and potential trend reversals. Integrating Keltner Channels with other technical tools can enhance trend analysis and confirm trading signals for a more comprehensive approach to market analysis.
Keltner Channel Calculation Explained
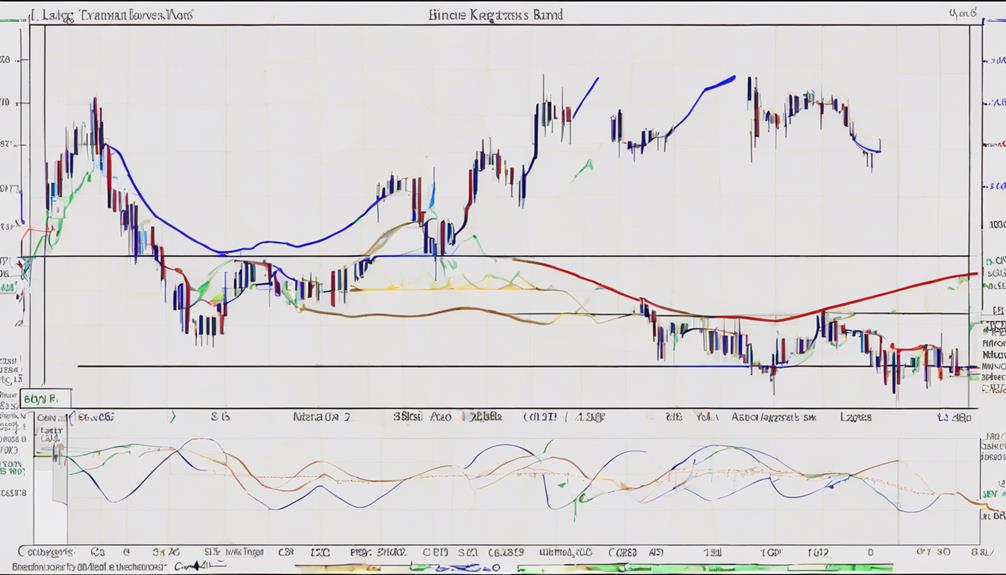
Utilizing a combination of exponential moving averages (EMAs) and the Average True Range (ATR), Keltner Channels are calculated to establish dynamic price boundaries for technical analysis.
The upper band of the Keltner Channel is determined by adding 2 times the ATR to the EMA, providing a volatility-based resistance level. Conversely, the lower band is calculated by subtracting 2 times the ATR from the EMA, defining support levels within the channel.
The middle line of the Keltner Channel, often set at a 20-period EMA, aids in identifying the trend. Average True Range (ATR) plays a crucial role in measuring the distance between the upper and lower bands, reflecting market volatility.
Advanced Trading Strategies With Keltner Channels
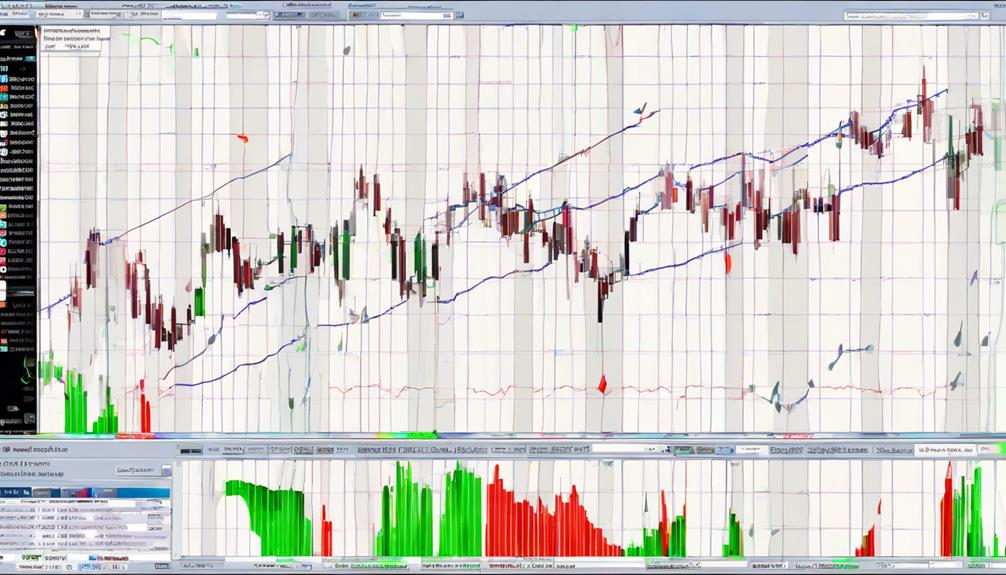
Advanced application of Keltner Channels in trading strategies involves integrating them with supplementary indicators like the Stochastic Oscillator to enhance precision in identifying market entry signals. By combining Keltner Channels with additional tools, traders can better navigate extreme market conditions and pinpoint potential trend reversals. Effective risk management techniques play a crucial role when utilizing Keltner Channels, aiding in determining optimal position entry and exit points.
Moreover, incorporating bearish/bullish reversal Candlestick patterns alongside Keltner Channels and Stochastic criteria can provide confirmation of trend reversals, adding further confidence to trading decisions. Setting target profits at twice the stop loss amount when employing Keltner Channels ensures a balanced risk-reward ratio, contributing to a more strategic approach to trading.
Keltner Channels Vs. Other Indicators
Comparing Keltner Channels to other indicators provides valuable insights into their distinct analytical characteristics and applications in technical analysis. When juxtaposed with Bollinger Bands, Keltner Channels offer a unique perspective on market dynamics. Here's how they differ:
- Keltner Channels use Average True Range (ATR) for volatility, while Bollinger Bands rely on standard deviation.
- Keltner Channels focus on trend direction, while Bollinger Bands emphasize volatility and price levels.
- Both indicators offer trade signals in strongly trending markets but serve different analytical purposes.
- Keltner Channels provide dynamic support and resistance levels, whereas Bollinger Bands help identify price volatility.
Understanding these disparities is crucial for traders looking to enhance their technical analysis strategies. While Bollinger Bands excel in capturing price volatility, Keltner Channels shine in identifying trend direction and dynamic support/resistance levels. By incorporating both indicators into their toolbox, traders can gain a more comprehensive view of market conditions and make well-informed trading decisions.
Overcoming Challenges With Keltner Channels

Navigating the complexities of Keltner Channels in technical analysis requires a strategic approach to overcome inherent challenges. Traders often face false breakouts caused by market noise, leading to misinterpretations of signals.
Determining the most suitable parameter settings for different assets poses another obstacle, as these settings may need adjustments to adapt to changing market conditions. Interpretation errors can arise when relying solely on Keltner Channels without the support of confirmation indicators, emphasizing the importance of incorporating additional tools for validation.
The effectiveness of Keltner Channels can be limited in choppy or sideways markets where trends are unclear, making it essential to be cautious when using this indicator in such conditions. To overcome these challenges, traders must remain vigilant, continuously assess their strategies, and be willing to adapt to evolving market dynamics to enhance the utility of Keltner Channels in technical analysis.
How Can I Utilize Keltner Channels for Effective Technical Analysis?
One of the best benefits of Keltner Channels is their ability to assist in effective technical analysis. By using these channels, traders can identify trends, volatility, and potential price reversals with more accuracy. This can lead to better entry and exit points, ultimately improving trading performance.
Frequently Asked Questions
What Is the Best Strategy for the Keltner Channel?
The best strategy for the Keltner Channel involves utilizing trend pullbacks and breakouts for entry and exit points. Combining with indicators like the Stochastic Oscillator enhances signals. Effective risk management is achieved by setting appropriate stop loss and target profit levels.
Is Keltner Channel Strategy Profitable?
Keltner Channel strategy can be profitable in trending markets, with proper risk management and trade execution. Historical data and backtesting reveal its effectiveness in capturing trends. Combining with other indicators enhances trading success.
What Setting Should a Keltner Band Be On?
The optimal setting for Keltner Bands depends on individual trading preferences, asset volatility, and market conditions. Traders commonly use a 20-period EMA with a multiplier of 2 times the ATR for standard settings, but adjustments may enhance performance.
What Is Technical Analysis Keltner Channel?
The Keltner Channel is a technical analysis tool used for trend determination in financial markets. It consists of three lines – a middle line based on EMA and upper/lower bands calculated using ATR – aiding traders in identifying trends, breakouts, and support/resistance levels.
Conclusion
In conclusion, unlocking Keltner Channels for effective technical analysis requires a deep understanding of its components and calculations. Despite its potential to enhance decision-making processes and improve trade accuracy, traders may face challenges in utilizing this indicator effectively.
By mastering advanced trading strategies and comparing Keltner Channels with other indicators, traders can navigate these challenges and harness the full potential of this volatility-based tool.