
As you explore the world of technical analysis, delving into the realm of candlestick patterns can provide you with valuable insights into market dynamics and potential trading opportunities.
By unraveling the intricacies of these patterns, you unlock a powerful tool that can guide your decision-making process and enhance your understanding of price movements.
Each candlestick tells a story, and deciphering these narratives can offer you a competitive edge in the unpredictable landscape of financial markets.
Understanding the nuances of candlestick patterns is more than just a skill; it's a strategic advantage that can elevate your trading acumen to new heights.
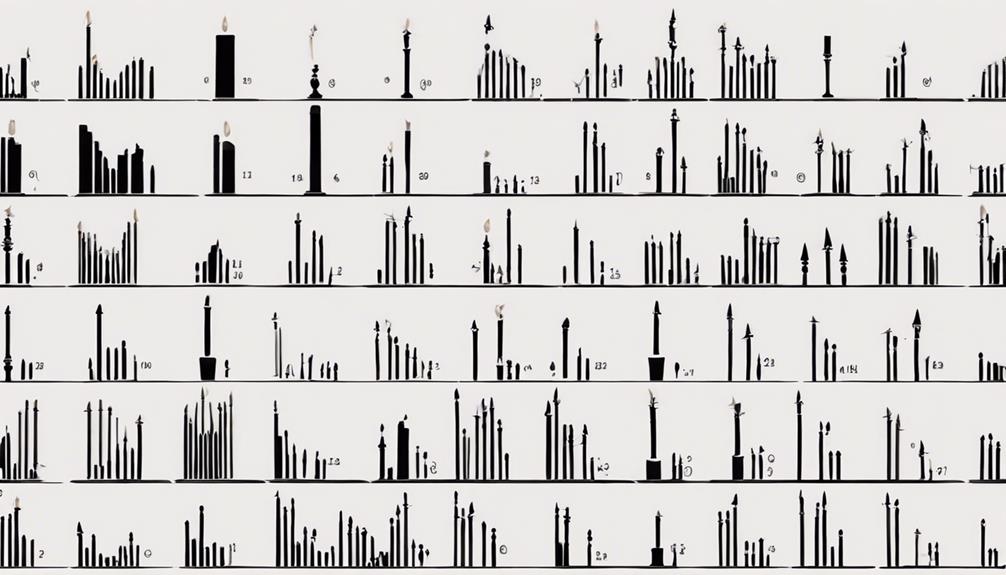
Understanding Candlestick Basics
To comprehend the fundamentals of candlestick analysis, focus on interpreting the intricate patterns revealed in price movements on charts.
Candlestick basics revolve around understanding the components of a candlestick, which include the body, wick, and color. The body represents the price range between the opening and closing prices, colored differently to indicate bullish or bearish movements.
The wick, also known as the shadow, shows the highest and lowest prices reached during the trading period. Identifying bullish candlesticks is crucial as they suggest potential upward price movements, while bearish candlesticks imply the opposite.
Identifying Bullish Candlestick Patterns
Having grasped the basics of candlestick analysis, your focus now shifts to recognizing bullish candlestick patterns that signal potential price reversals to the upside after a downtrend.
Examples of these patterns include the Hammer, Inverse Hammer, and Bullish Engulfing patterns. When these patterns emerge on a chart, they indicate opportunities for taking long positions in the market.
This is because bullish candlestick patterns signify that buyers are gaining control, leading to a shift in market sentiment towards a more positive outlook. By identifying and understanding these patterns, traders can capitalize on potential reversals and upward price movements that may follow, making informed decisions based on the changing market sentiment.
Recognizing Bearish Candlestick Patterns
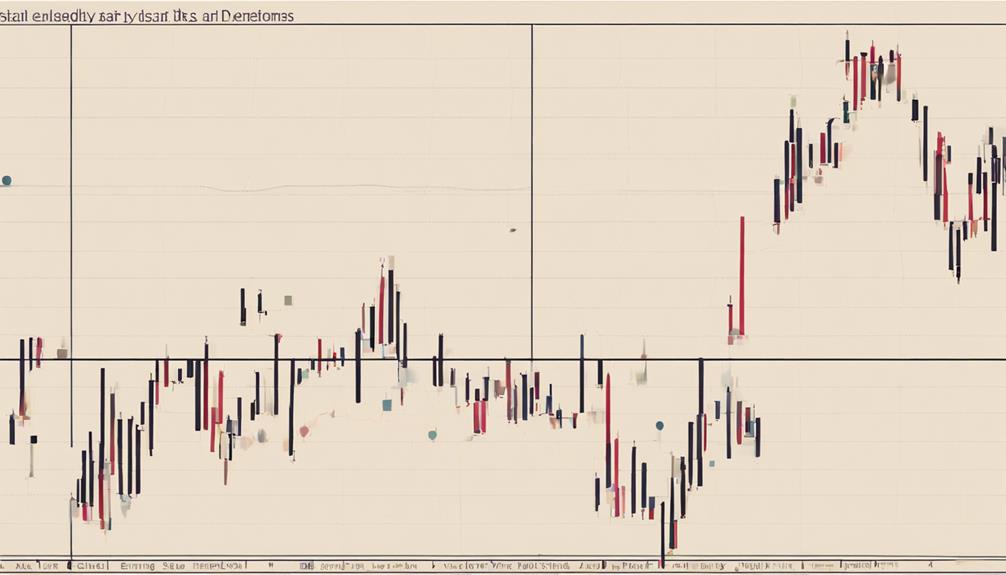
Bearish candlestick patterns, such as the Hanging Man, Shooting Star, and Bearish Engulfing patterns, are crucial indicators that signal potential market resistance and downtrends. Recognizing these patterns is essential for making informed decisions when trading.
Here are three key points to help you understand bearish candlestick patterns:
- Short Positions: Bearish candlestick patterns often present opportunities for traders to take short positions in the market.
- Reversal in Price Movement: These patterns frequently indicate a potential reversal in price movement after an uptrend.
- Informed Decisions: Understanding and identifying bearish candlestick patterns can assist traders in making strategic and informed choices in their trading activities.
Analyzing Continuation Candlestick Patterns
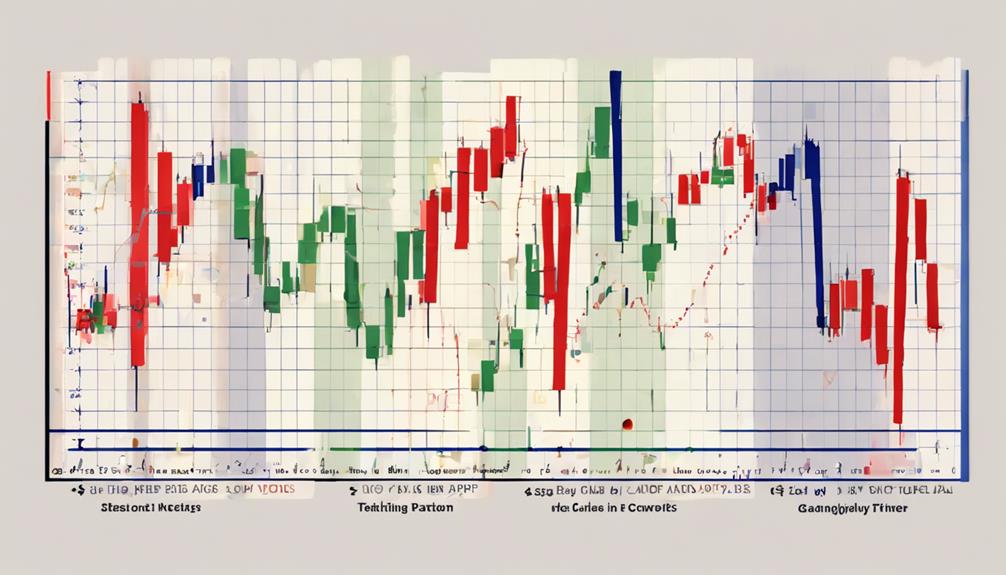
Continuation candlestick patterns, such as the Doji, Spinning Top, and Falling Three Methods, provide valuable insights for traders by signaling potential pauses in the market trend and helping identify periods of consolidation or indecision.
These candlestick patterns are crucial as they indicate the prevailing trend is likely to continue. By recognizing these patterns, traders can confirm the ongoing market direction and make informed decisions.
The Doji signifies market indecision, the Spinning Top shows a balance between buyers and sellers, while the Falling Three Methods suggests a potential continuation of a downtrend.
Understanding these patterns can help traders navigate the market with more confidence, especially when looking for opportunities during pauses in the market trend.
Applying Candlestick Patterns in Trading

To effectively utilize candlestick patterns in trading, you must develop a deep understanding of how these patterns reflect market sentiment and influence decision-making processes. When applying candlestick patterns in your trading strategies, consider the following:
- Identifying Trend Reversals: Candlestick patterns like Doji and Hammer can signal potential reversals in the market trend.
- Recognizing Engulfing Patterns: Engulfing patterns indicate a shift in market momentum and can help traders make informed decisions.
- Interpreting Price Action: Understanding how candlestick patterns interact with price movements is crucial for successful trading strategies.
Are Candlestick Patterns in Technical Analysis a Popular Topic in Books?
Yes, candlestick patterns in technical analysis are a popular topic in books. Many traders and investors seek guidance from top candlestick pattern books to understand and interpret these patterns accurately. Whether they are beginners or seasoned professionals, these books are essential for anyone looking to master the art of technical analysis.
Frequently Asked Questions
What Is the Most Accurate Candlestick Pattern?
The most accurate candlestick pattern for you varies based on your trading style and the market. Engulfing, Morning/Evening Star, and Doji patterns are commonly reliable. Confirm with subsequent price action. Combining patterns and indicators enhances accuracy. Backtest to refine your strategy.
How Many Candlestick Patterns Are There in Technical Analysis?
You're curious about the number of candlestick patterns in technical analysis. There are over 50 recognized patterns, from simple single-bar ones to more complex multi-bar formations. Understanding these patterns can boost your trading strategies.
What Is the Most Powerful Candlestick Pattern?
The most powerful candlestick pattern is the Bullish Engulfing pattern. It signals a strong reversal from a downtrend to an uptrend. Traders rely on it for identifying buying pressure and potential entry points, enhancing trend reversal predictions.
How Is Candlestick Chart Used in Technical Analysis?
In technical analysis, you use candlestick charts to analyze price movements. They show open, high, low, and close prices, aiding in trend identification and decision-making. Candlestick patterns help gauge market sentiment, crucial for informed trading.
Conclusion
You have now gained a comprehensive understanding of candlestick patterns in technical analysis. By mastering these patterns, you can effectively identify market sentiment, support/resistance levels, and trading opportunities.
Remember to integrate candlestick patterns with other technical analysis tools for more accurate predictions. Keep honing your skills and analyzing the truth of theories to enhance your confidence and decision-making in the financial markets.
Happy trading!