
You may not be aware that Bollinger Bands can provide valuable insights beyond just identifying overbought and oversold conditions in crypto trading. Understanding the nuances of these bands can significantly enhance your trading strategies and decision-making process.
By exploring the seven key insights into Bollinger Bands, you can gain a deeper understanding of how to leverage this powerful tool effectively for improved trading outcomes.
Bollinger Bands Calculation Method
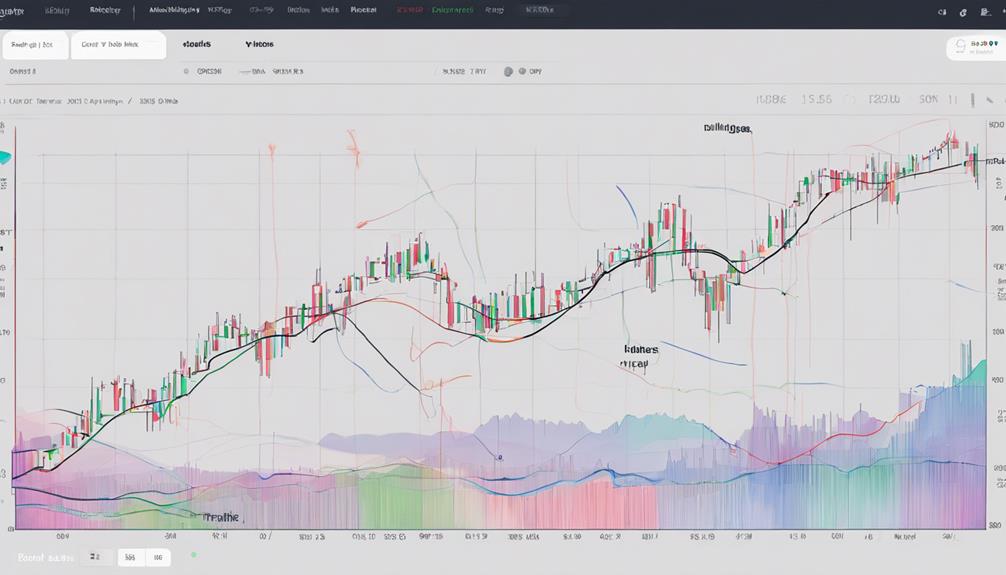
When calculating Bollinger Bands for crypto trading, precision is key in determining optimal entry and exit points based on market volatility. These bands are derived from a 20-day Simple Moving Average (SMA), with the upper band calculated by adding 2 times the 20-day Standard Deviation (SD) to the SMA, and the lower band obtained by subtracting 2 times the 20-day SD from the SMA.
Importance of Multiple Bands Analysis
Analyzing multiple bands in Bollinger Bands is crucial as it offers a Band Width Analysis that indicates the strength of price movements.
This method allows you to assess volatility levels effectively and confirm trends, providing you with a comprehensive understanding of market conditions.
Band Width Analysis
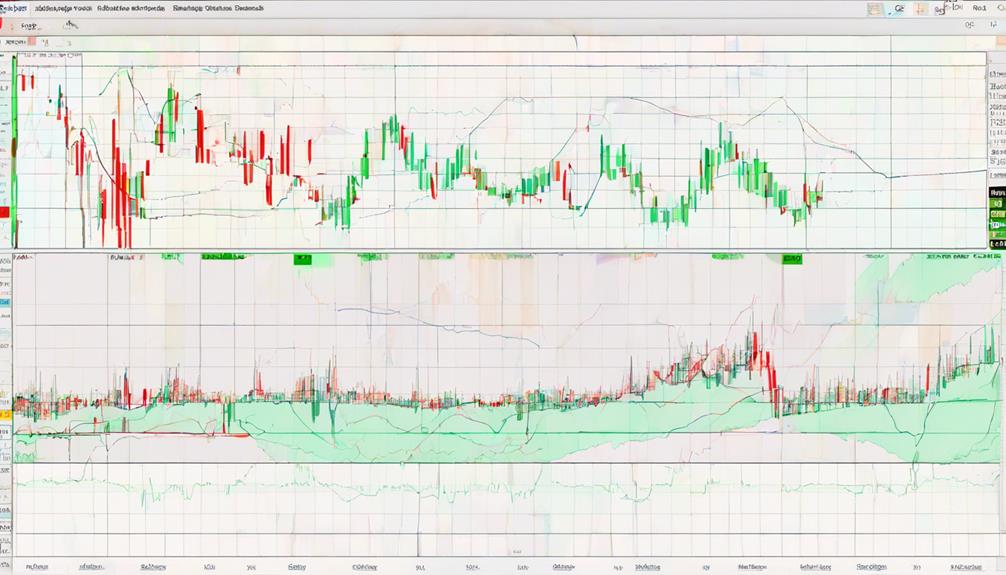
To gain a comprehensive understanding of market volatility and potential price movements in crypto trading, incorporating multiple bands analysis in band width evaluation is crucial. Band width analysis, a key component of Bollinger Bands, measures the distance between the upper and lower bands to gauge volatility levels.
A wider band width suggests higher volatility and the potential for significant price movements, while a narrower band width indicates lower volatility and a possible period of consolidation. By utilizing multiple bands analysis to compare different timeframes or settings of Bollinger Bands, traders can obtain a more holistic view of market conditions.
Monitoring band width changes over time enables insights into upcoming price trends and potential breakouts in cryptocurrency trading, assisting traders in making well-informed decisions regarding entry, exit, and position sizing based on varying volatility levels.
Volatility Assessment Method
Utilizing multiple bands analysis in assessing volatility provides traders with a comprehensive perspective on market conditions and price movements in crypto trading. When examining Bollinger Bands, consider the following:
- Price Deviation: Track deviations from the Simple Moving Average to gauge market volatility.
- Overbought and Oversold: Upper bands signal potential overbought conditions, while lower bands indicate potential oversold conditions.
- Price Trends: Analyze the direction of price movements in relation to the bands for trend identification.
- Decision-making: Use the width between bands to make informed decisions on trading strategies during periods of high or low volatility.
This approach enables traders to spot potential breakout or reversal points, enhancing their decision-making process in the crypto market.
Trend Confirmation Technique
By incorporating multiple bands analysis, traders can significantly enhance their ability to confirm trends and make informed decisions in crypto trading based on the strength and reliability of trend signals. Analyzing various Bollinger Bands settings provides complementary signals for assessing trend strength.
When comparing short-term and long-term bands, traders can determine the duration and intensity of a trend. Cross-referencing bands with different periods aids in validating trend direction and potential reversals. This approach increases the accuracy of trend identification and trade signals, offering a comprehensive view of the market dynamics.
Utilizing multiple Bollinger Bands not only confirms the trend but also enriches the overall trend analysis by providing a nuanced understanding of market movements.
Trend Identification With Bollinger Bands
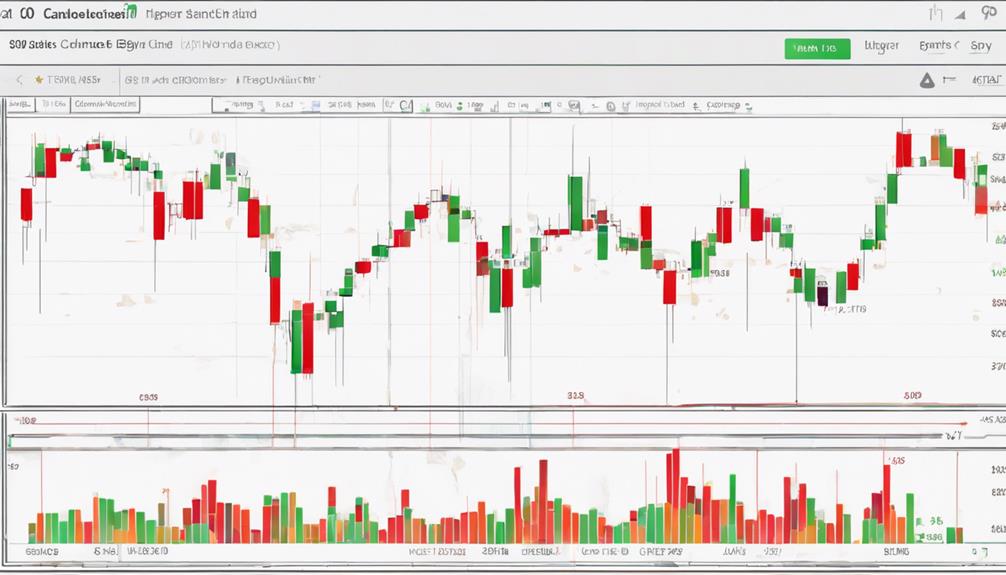
Identifying trends with Bollinger Bands involves closely monitoring price volatility and deviations from the mean, particularly focusing on consistent touches of the upper or lower bands. When using Bollinger Bands for trend identification, consider the following:
- Uptrend: Look for prices consistently touching the upper band, indicating a strong uptrend.
- Downtrend: Prices consistently touching the lower band suggest a strong downtrend.
- Middle Band Slope: The slope of the middle band can confirm the direction of the trend.
- Width of the Bands: Wider bands indicate higher volatility, which can signify potential trend strength.
Bollinger Bands Squeeze Strategy
When implementing the Bollinger Bands Squeeze Strategy, understanding the basics of the squeeze setup and timing entry points is crucial for your trading success.
Identifying periods of low volatility and preparing for potential breakouts or breakdowns can help you capitalize on explosive price movements.
Squeeze Setup Basics
Anticipating significant price movements, Bollinger Bands Squeeze setups are crucial for identifying potential breakout opportunities in crypto trading. When a Bollinger Squeeze occurs, price volatility contracts, hinting at an imminent price breakout. To grasp this concept better, consider the following basics:
- Volatility Contraction: Bollinger Bands come closer together, indicating reduced volatility.
- Anticipating Movements: Squeeze setups help in foreseeing substantial price shifts.
- Profitable Breakouts: Breakouts resulting from the squeeze pattern can offer lucrative trading opportunities.
- Enhanced Signals: Combining Bollinger Bands Squeeze with other indicators can boost trading signals and confirm trends effectively.
Timing Entry Points
During low volatility periods when Bollinger Bands contract, the Timing Entry Points strategy strategically positions traders to anticipate and capitalize on forthcoming price breakouts in the crypto market. By identifying periods of consolidation through the Bollinger Bands Squeeze Strategy, traders aim to capture explosive price moves that follow tight ranges.
This approach focuses on pinpointing the timing entry points that precede significant price movements, offering potential trade opportunities when volatility returns to the market. Traders utilize the squeeze setup to gauge when prices are likely to experience a breakout, enabling them to enter positions before the anticipated price surge.
Understanding these timing entry points within the context of Bollinger Bands can enhance trading strategies and decision-making processes in the dynamic crypto market.
Bollinger Bands Vs. Keltner Channels
Comparatively, Bollinger Bands and Keltner Channels employ distinct methodologies in analyzing price movements and identifying trading signals in the cryptocurrency market. When comparing the two:
- Calculation Method:
- Bollinger Bands: Use standard deviation for volatility.
- Keltner Channels: Utilize average true range (ATR) for measuring price movements.
- Trade Signals:
- Bollinger Bands: Focus on overbought and oversold conditions.
- Keltner Channels: Generate more trade signals, emphasizing price range and trend strength.
- Preference:
- Personal choice plays a role in selecting between the two based on trading style and strategy.
- Focus:
- Bollinger Bands: 20-day simple moving average and standard deviation for volatility.
- Keltner Channels: Emphasize price range and trend strength, offering alternative tools for technical analysis.
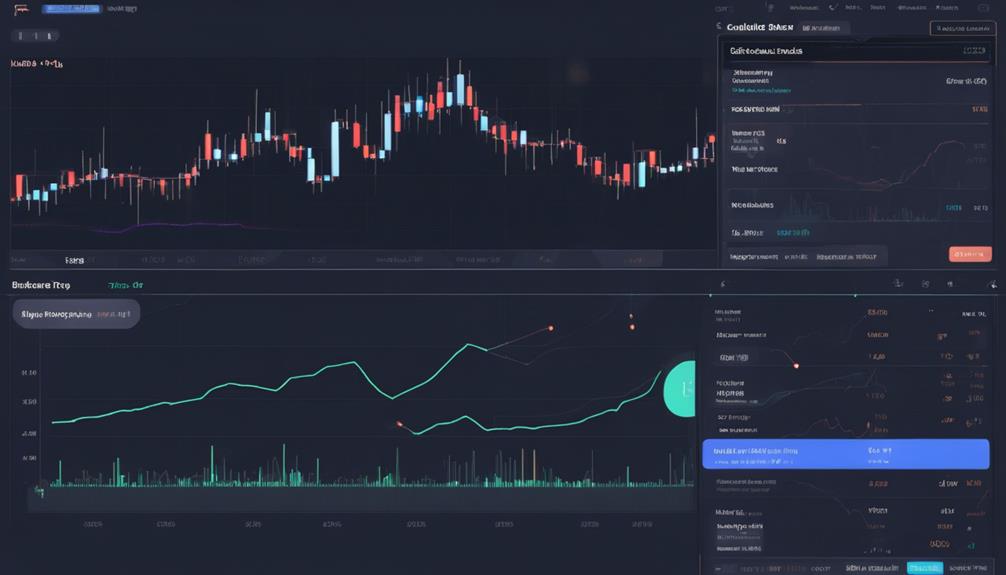
Practical Application in Crypto Trading
In applying Bollinger Bands to crypto trading, traders leverage the identification of overbought and oversold conditions for informed decision-making. These bands, based on a 20-day simple moving average and standard deviations, offer insights into potential price boundaries. By adapting settings to the specific cryptocurrency being analyzed, traders can tailor their trading strategy to the asset's characteristics.
Bollinger Bands serve as a valuable technical analysis tool, aiding in trend following and gauging price action. Moreover, they play a crucial role in setting stop-loss orders and managing risk by providing a visual representation of volatility. Incorporating Bollinger Bands into your crypto trading approach can enhance your understanding of market dynamics and improve your trading decisions.
Can Bollinger Bands Be Used for Crypto Trading as Well as Day Trading?
Yes, mastering Bollinger Bands trading can be beneficial for both crypto trading and day trading. These bands help identify potential buy and sell opportunities based on price volatility. Traders can use this tool to make informed decisions and manage risk effectively in various markets, including cryptocurrencies.
How Can I Use Bollinger Bands for Crypto Trading to Improve My Day Trading Success?
When it comes to mastering Bollinger Bands day trading for crypto, there are a few key strategies to keep in mind. First, use the bands to identify potential price breakouts and trend reversals. Second, pay attention to the width of the bands to gauge market volatility. Finally, combine Bollinger Bands with other technical indicators for confirmation signals.
Risk Management With Bollinger Bands
Utilize Bollinger Bands as a strategic tool for efficient risk management in crypto trading by incorporating stop-loss orders based on band movements. When considering risk management with Bollinger Bands, remember these key points:
- Optimal Position Sizes: Bollinger Bands aid in determining the right position sizes to effectively manage risk.
- Minimizing Losses: Incorporating Bollinger Bands in risk management strategies can help minimize potential losses, especially in volatile markets.
- Identifying Trend Reversals: Monitoring band movements can assist in identifying potential trend reversals, prompting adjustments to risk exposure.
- Enhancing Discipline: Properly utilizing Bollinger Bands enhances overall trading discipline and decision-making processes, leading to more informed trading strategies.
Frequently Asked Questions
How Do You Use Bollinger Bands in Crypto Trading?
To use Bollinger Bands in crypto trading, observe price movements relative to the bands. When prices approach the upper band, it may indicate overbought conditions, while nearing the lower band could signal oversold conditions, aiding in decision-making.
What Do You Look for in Bollinger Bands?
When looking at Bollinger Bands, you observe for price movements breaching upper or lower boundaries. Analyzing these breaches helps gauge market conditions. Keep an eye on band distances for insights on volatility and potential reversals.
Which Indicators Are Most Effective When Used in Conjunction With Bollinger Bands?
When using Bollinger Bands, combining them with indicators like RSI, Moving Averages, MACD, volume analysis, and Stochastic Oscillator can enhance your analysis. These indicators help confirm signals, identify trends, and validate potential reversals, improving your trading decisions.
How Do You Use Bollinger Bands Effectively?
To use Bollinger Bands effectively, analyze price movements relative to the bands for overbought or oversold conditions. Utilize the 20-day moving average as a baseline. Enhance analysis accuracy by combining Bollinger Bands with other indicators for better trading decisions.
Conclusion
In conclusion, Bollinger Bands provide a powerful tool for crypto traders to analyze volatility, identify trends, and make informed decisions. By incorporating multiple bands analysis, using strategies like the Bollinger Squeeze, and practicing risk management, traders can navigate the market with confidence.
Remember, combining Bollinger Bands with other indicators enhances your trading arsenal, allowing you to stay ahead of the curve and maximize your potential profits. Stay sharp, stay strategic, stay successful in your crypto trading endeavors!