
Exploring the intricacies of the Chaikin Money Flow Indicator unveils a world of analytical potential for traders seeking to navigate the complexities of the stock market. By understanding the calculations and interpretations behind this indicator, investors can gain valuable insights into market trends and shifts in momentum.
However, the true power of the CMF lies not just in its standalone use but in its strategic integration with other technical tools. The interplay between these indicators can offer a more comprehensive view of market dynamics, potentially leading to informed decision-making and enhanced trading strategies.
What Is Chaikin Money Flow?
Analyzing the accumulation and distribution of stocks, the Chaikin Money Flow indicator, developed by Marc Chaikin in the 1980s, quantifies money flow volume over a specific period. This financial tool is pivotal in identifying market buying or selling pressure, aiding traders in understanding market sentiment.
The CMF is crucial for traders as it assists in trend confirmation, strength measurement, and recognizing potential market reversals or breakouts. By examining the relationship between price and volume, the CMF provides insights into the underlying dynamics of the market.
Notably, the indicator calculates the 21-day average of daily money flow divided by the 21-day average of volume to derive its value. In essence, the Chaikin Money Flow (CMF) is an invaluable indicator in the realm of trading, offering a quantitative measure of money flow volume that is instrumental in making informed trading decisions based on the accumulation and distribution of stocks.
Calculating Chaikin Money Flow
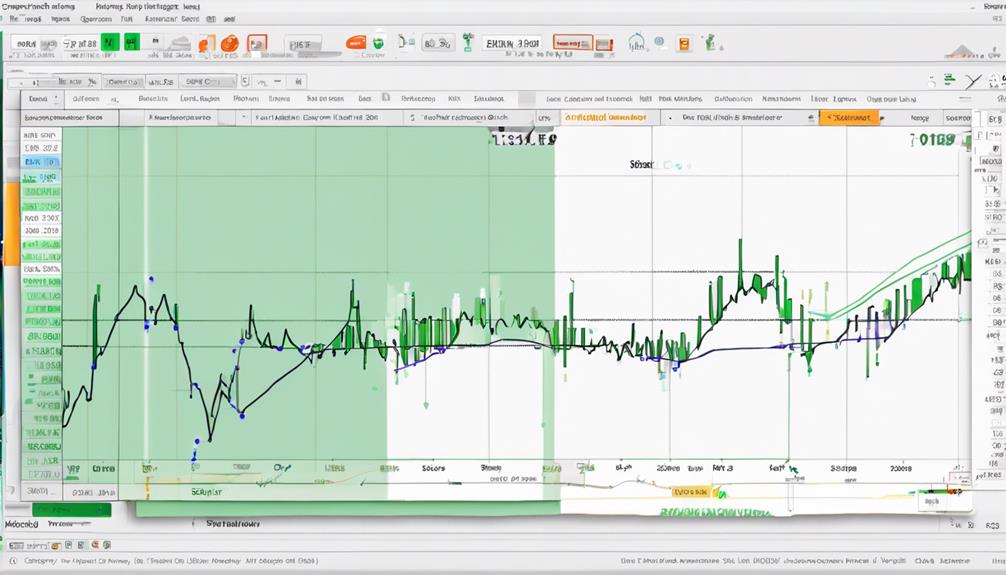
To compute the Chaikin Money Flow Indicator, traders calculate the money flow multiplier and money flow volume, then average these values over a specific period, typically using a 21-day default period for analysis.
- Money Flow Multiplier (MF Multiplier): This technical value is calculated by determining [(Close – Low) – (High – Close)] / (High – Low). It highlights the relationship between the daily money flow and the daily price range.
- Money Flow Volume (MFV): This value is derived by multiplying the MF Multiplier by the daily volume. It quantifies the amount of money entering or leaving the market on a given day.
- Chaikin Money Flow Calculation: By averaging the MFV over a specific period, usually 21 days, traders obtain the Chaikin Money Flow indicator. This indicator, created by Marc Chaikin, offers insights into the balance between buying and selling pressure in the market.
- Interpreting Price Action: The Chaikin Money Flow indicator identifies divergences between price and value. A divergence occurs when price action contradicts the indicator, signaling potential shifts in buying and selling pressure.
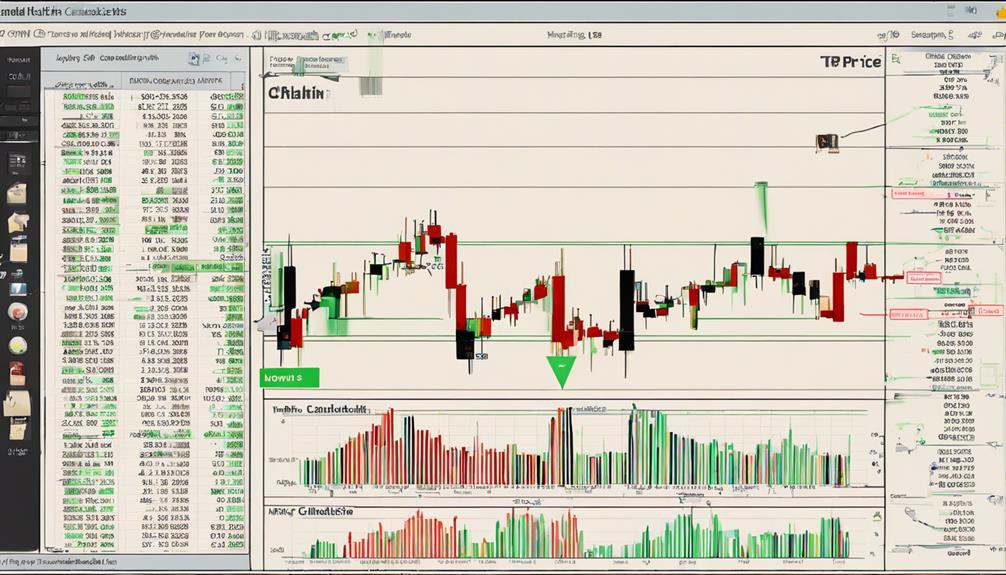
Interpreting Chaikin Money Flow
Interpreting the Chaikin Money Flow indicator involves analyzing the flow of funds into or out of a security over a specific period, providing valuable insights into market sentiment and potential price movements. The indicator, created by Marc Chaikin, fluctuates around the zero line, with the money flow multiplier obtained by multiplying the volume of money flow by the closing price.
When CMF is above zero, it suggests buying pressure, while below zero indicates selling pressure. A new high in CMF demonstrates strong buying pressure, correlating with bullish price moves. Conversely, a new low signifies strong selling pressure, aligning with bearish price moves.
Bullish divergence occurs when the price makes a new low while CMF does not confirm it. In contrast, bearish divergence happens when the price makes a new high without CMF confirmation. Traders typically use the default 20-day CMF period to analyze trends and confirm breakouts from support and resistance levels.
Trading Strategies With CMF
When implementing trading strategies with the Chaikin Money Flow indicator, it is essential to leverage its trend identification capabilities in conjunction with other technical indicators for optimal decision-making in the financial markets.
- Utilize Trend Lines: Incorporate trend lines along with CMF to identify trends and potential reversals accurately.
- Zero Line Crosses: Pay attention to crosses at the zero line as they indicate trend changes and potential trading signals.
- Significant Crosses: Look for significant crosses in CMF as they provide more reliable trading indications.
- Divergence Signals: When there is a noticeable discrepancy between price movements and CMF, it can signal a possible trend reversal.
CMF Vs Money Flow Index
In comparing the Chaikin Money Flow (CMF) indicator to the Money Flow Index (MFI), it is crucial to recognize their distinct methodologies for analyzing market trends and generating trading signals.
The Money Flow Index (MFI) incorporates recent price movements and volume in its calculation, whereas the Chaikin Money Flow (CMF) focuses solely on volume, making it a volume indicator rather than a volume-weighted Relative Strength Index (RSI) like MFI.
Consequently, trading signals derived from CMF and MFI can differ due to their unique calculation methods. Understanding the variances in formulas is paramount before utilizing CMF or MFI for buy/sell signals.
While both indicators provide insights into market dynamics, traders must grasp the nuances in their approaches to effectively interpret and act upon the signals they generate.
How Can I Apply the Chaikin Money Flow Indicator in Real-world Situations?
The practical Chaikin Money Flow indicator can be applied in real-world situations by analyzing the flow of money in and out of a stock. By tracking the buying and selling pressure, traders can determine the strength of a trend and make more informed decisions in their investment strategies.
Frequently Asked Questions
How Do You Use Chaikin Money Flow Indicator?
To utilize the Chaikin Money Flow indicator effectively, traders analyze buying and selling pressure in the market. It aids in confirming breakouts, identifying trend movements, and detecting potential reversals through divergence signals. Combining it with other indicators can enhance trading signals' reliability.
What Is the Formula for the Chaikin Money Flow Indicator?
The formula for the Chaikin Money Flow (CMF) indicator involves calculating the average of money flow over a specified period divided by the average volume over the same period. This helps determine the CMF value, aiding in analyzing market buying or selling pressure.
What Is the Value of the Chaikin Money Flow Indicator?
The value of the Chaikin Money Flow Indicator, ranging from +1 to -1, reflects market sentiment. Positive values denote buying pressure, while negative values signal selling pressure. Typically falling within +0.5 to -0.5, CMF aids in trend analysis and identifies potential reversals.
How Do You Calculate Money Flow Indicator?
To calculate the Money Flow Indicator, multiply the Money Flow Multiplier by the period's volume. The Money Flow Multiplier is derived from the high, low, and closing prices. This indicator helps gauge buying and selling pressure in the market.
Conclusion
In conclusion, the Chaikin Money Flow Indicator offers valuable insights into stock accumulation and distribution trends. By calculating CMF over a 21-day period and interpreting the results, traders can identify market strength, trend reversals, and potential entry/exit points.
It is crucial to combine this indicator with others for a comprehensive trading strategy. Remember, in the world of trading, knowledge is power, and the Chaikin Money Flow Indicator can be a powerful tool in your arsenal.