
Understanding how to interpret forex volatility indicators is crucial for any trader navigating the intricacies of the market. These indicators serve as vital tools in assessing risk levels, identifying potential opportunities, and adapting strategies to market conditions.
Exploring the top 5 insights in this realm offers a nuanced perspective on market dynamics, risk management, and the broader implications of volatility on trading decisions. By delving into the intricacies of these indicators, traders can gain a competitive edge in their decision-making process and enhance their overall trading performance.
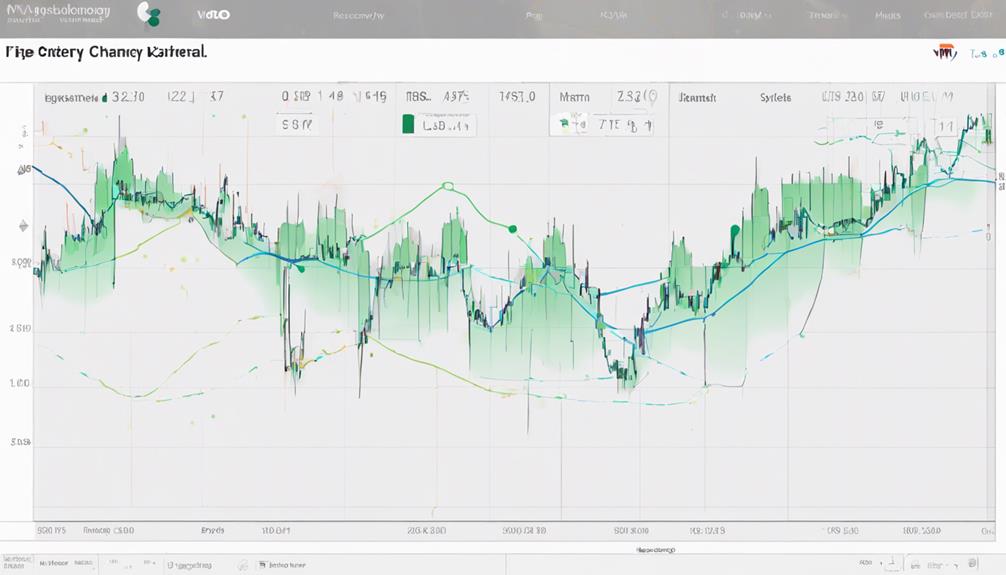
Bollinger Bands Interpretation
Analyzing Bollinger Bands provides traders with a comprehensive framework for interpreting market volatility and potential price movements. Bollinger Bands, composed of a middle band (SMA) and upper/lower bands based on standard deviation, serve as dynamic indicators that expand and contract in response to market volatility.
When prices touch the upper band, it suggests overbought conditions, indicating a potential reversal or correction. Conversely, touching the lower band may signal oversold conditions, hinting at a potential buying opportunity. These bands effectively highlight periods of low volatility preceding potential spikes in market activity.
Keltner Channel Analysis
In evaluating market volatility and potential breakout points, Keltner Channel Analysis utilizes the Average True Range (ATR) to provide traders with a structured approach to assessing price movements in currency pairs. The Keltner Channel consists of three lines: an upper band, a middle line, and a lower band calculated based on ATR.
High volatility is indicated by expanding Keltner Channel bands, while contracting bands suggest low volatility in the market. Traders leverage the Keltner Channel to determine trend direction and identify potential breakout points for trading opportunities. This indicator is easily accessible on various trading platforms, allowing traders to analyze price volatility efficiently.
Donchian Channel Insights
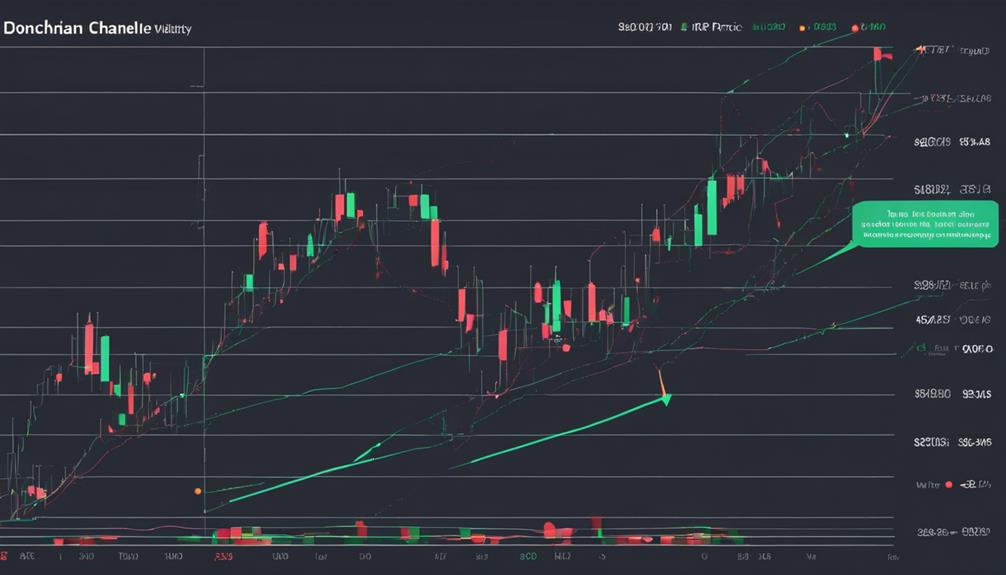
Utilizing the Donchian Channel in forex trading provides traders with a straightforward method for identifying trend breakouts and continuations based on price movements. The Donchian Channel, named after Richard Donchian, consists of three lines: an upper channel line, a lower channel line, and a middle line representing the average price.
Here are some key insights into the Donchian Channel:
- Donchian Channels help traders spot breakouts and trend continuations by analyzing price movements.
- Breakouts above the upper channel line present potential buying opportunities in the market.
- Conversely, breakouts below the lower channel line signal potential selling opportunities for traders.
- The Donchian Channel serves as a useful tool for managing volatility and capturing trends effectively in the dynamic forex market environment.
Average True Range Evaluation
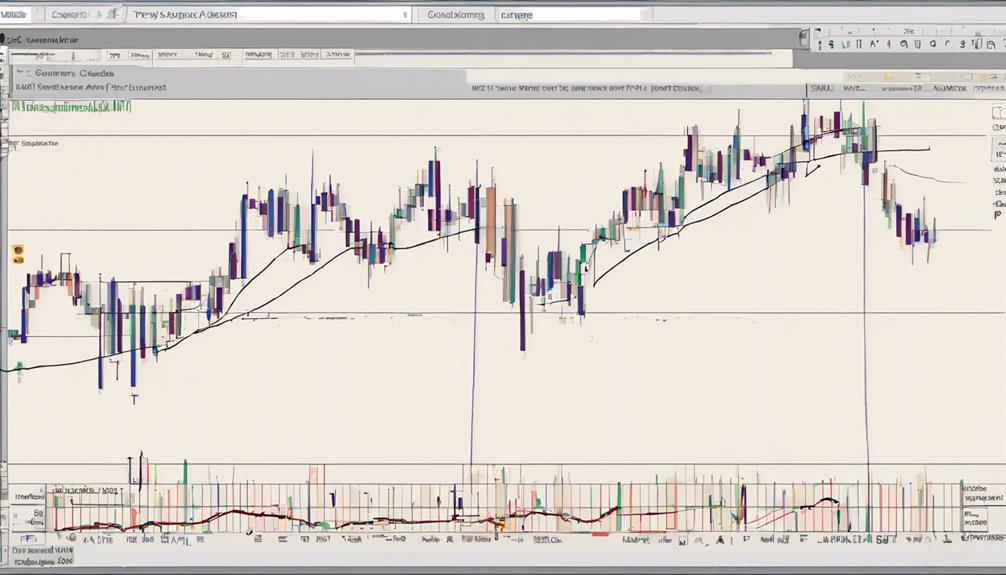
When evaluating market volatility in forex trading, one essential tool that traders rely on is the Average True Range (ATR) calculation. ATR measures the average price range over a specific period, considering the highest high and lowest low within each trading day for volatility assessment.
Traders use ATR values to gauge market volatility, with higher values indicating increased volatility and lower values suggesting calmer market conditions. Understanding ATR is crucial for setting appropriate stop-loss and take-profit levels based on price fluctuations.
Understanding India VIX
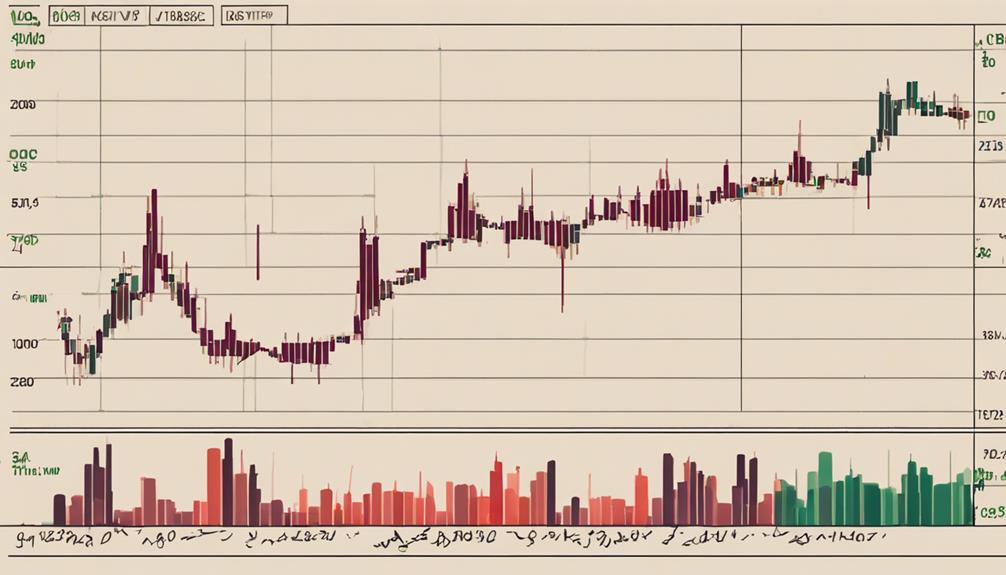
Amidst the evaluation of market volatility through tools like the Average True Range in forex trading, a significant aspect worth understanding is the India VIX, a volatility index that provides insights into the near-term volatility expectations within the Indian stock market.
- India VIX is a volatility index that measures the market's expectation of near-term volatility in the Indian stock market.
- It reflects investor sentiment and fear levels, with higher values indicating increased market uncertainty.
- India VIX is calculated based on the NIFTY 50 index options prices and is used by traders to gauge potential market movements.
- Traders can use India VIX as a contrarian indicator, looking for opportunities when fear levels are extremely high or low.
Understanding the India VIX can offer traders valuable information to adjust their strategies based on prevailing market sentiment and volatility expectations in India. By monitoring this index, traders can better navigate market uncertainties and potentially capitalize on market movements driven by shifts in investor sentiment and fear levels.
Frequently Asked Questions
What Is the Best Forex Indicator for Volatility?
The best forex indicator for volatility is the Average True Range (ATR). ATR accurately measures price fluctuations over a specific period, providing valuable insights into market volatility levels. Traders utilize ATR to set stop-loss and take-profit levels effectively.
How Do You Analyse Volatility Indices?
To analyze volatility indices, examine market price fluctuations over a set timeframe. Utilize historical data to calculate standard deviations and quantify market volatility levels. Incorporate indicators like ATR and VIX to gauge price change speed and magnitude accurately.
How to Read Chaikin Volatility?
Chaikin Volatility is read by analyzing the percentage difference between high and low prices over a defined period. Higher values signify increased market volatility, aiding traders in spotting potential breakouts and trend shifts, guiding strategic trading decisions.
Which Indicator Is Best for Volatility 75 Index?
The Average True Range (ATR) indicator stands out as a top choice for analyzing volatility in the Volatility 75 Index market. Offering insights into market fluctuations, ATR aids traders in setting optimal risk management strategies for informed decision-making.
Conclusion
In the world of forex trading, volatility indicators serve as guiding beacons, shedding light on market risk levels and potential opportunities. Like a compass in a storm, these indicators help traders navigate the unpredictable waters of the forex market with precision and insight.
By understanding and interpreting these indicators effectively, traders can make informed decisions, mitigate risks, and capitalize on opportunities that arise in the ever-changing landscape of forex trading.