
When it comes to navigating the complexities of calculating the Stochastic Oscillator indicator, think of it as deciphering a puzzle with interconnected pieces waiting to reveal a clear picture.
As you start unraveling the intricacies of this powerful tool, you'll uncover the key components that drive its effectiveness in predicting market trends.
However, understanding the inner workings of the Stochastic Oscillator goes beyond mere calculations; it opens the door to a world where informed decisions can be made with confidence.
Understanding Stochastic Oscillator Calculation
To comprehend the Stochastic Oscillator calculation fully, begin by evaluating the relationship between the current closing price and the highest and lowest prices within a specified timeframe.
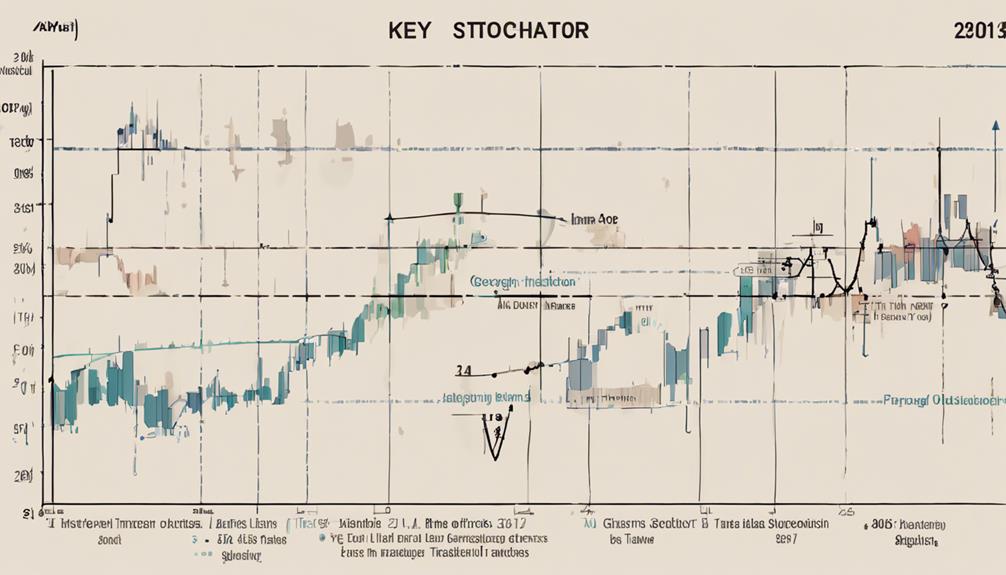
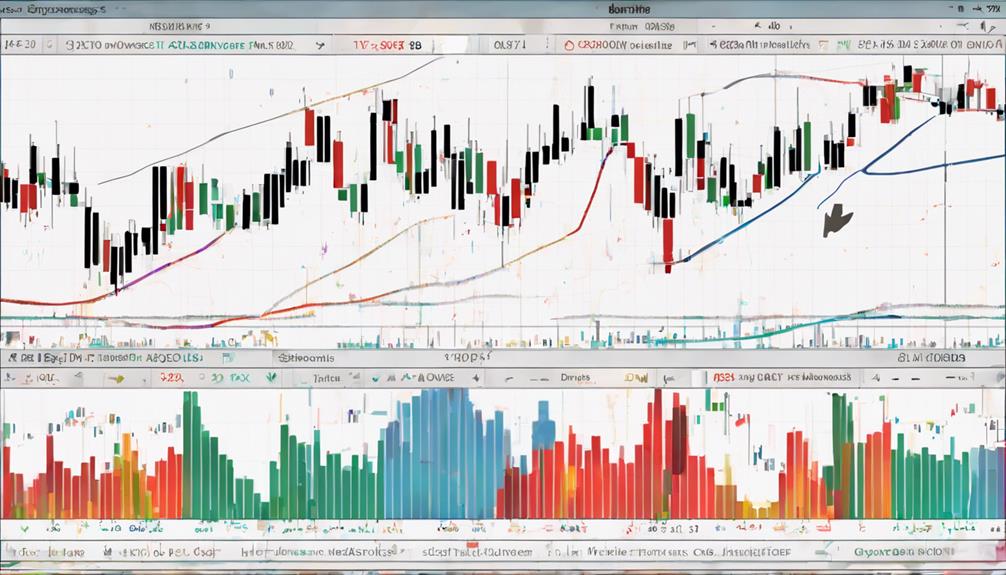
The Stochastic Oscillator, a momentum indicator, aids in understanding market reversals. The calculation involves deriving %K, which signifies the position of the closing price concerning the price range as a percentage. Additionally, %D, a 3-day Simple Moving Average of %K, provides a smoother representation.
Both %K and %D range between 0 and 100, with levels above 80 suggesting overbought conditions and below 20 indicating oversold conditions. Mastering the interpretation of these values is essential for recognizing potential shifts in market momentum and anticipating reversals accurately.
Historical Development of Stochastic Indicator
The inception of the Stochastic Indicator by Dr. George Lane in the late 1950s marked a significant advancement in technical analysis tools for measuring market momentum. This indicator plays a crucial role in predicting potential market reversals by comparing the recent closing price of an asset to its highest and lowest prices over a specified period.
Operating on a scale of 0 to 100, readings above 80 signal overbought conditions, while those below 20 indicate oversold conditions. Traders in stock trading, forex, and various financial markets heavily rely on the Stochastic Indicator to make informed decisions. Its ability to provide insights into momentum levels makes it a valuable tool for assessing market conditions and optimizing trading strategies.
Interpreting Stochastic Oscillator Readings
Interpreting Stochastic Oscillator readings involves analyzing key numerical values to assess market momentum and potential trend changes effectively. When interpreting the Stochastic Oscillator readings, keep the following points in mind:
- Stochastic oscillator readings above 80 indicate overbought conditions, signaling a possible price reversal.
- Readings below 20 on the stochastic oscillator suggest oversold conditions, presenting a potential buying opportunity.
- The crossover of %K and %D lines on the stochastic oscillator can generate buy or sell signals based on market momentum.
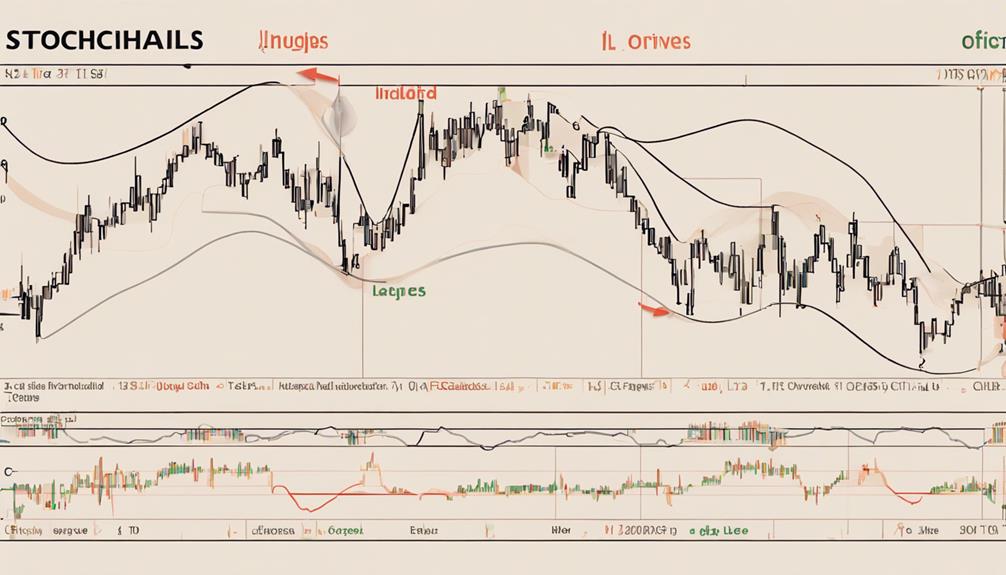
- Divergence between price action and the stochastic oscillator readings can indicate upcoming trend reversals.
Understanding these aspects of the stochastic oscillator can help you identify buy signals, sell signals, and anticipate price reversals effectively.
Practical Application of Stochastic Indicator
Utilize the Stochastic Oscillator as a reliable tool for identifying optimal entry and exit points in the market based on overbought and oversold conditions. The Stochastic Indicator presents trading signals through divergence patterns and crossovers between the %K and %D lines.
When the indicator reaches overbought or oversold zones, it can indicate potential reversals in the market, offering opportunities for strategic trades. By generating buy/sell signals, traders can make informed decisions to maximize profits.
Additionally, combining the Stochastic Oscillator with other technical indicators enhances its effectiveness by providing confirmation of potential market movements. This technical tool empowers traders to improve their trading strategies and make more informed decisions in dynamic market conditions.
Maximizing Stochastic Oscillator Effectiveness
To enhance the effectiveness of the Stochastic Oscillator, adjusting the time period in its calculation allows for a more precise sensitivity to market fluctuations. When maximizing the Stochastic Oscillator's impact, consider the following:
- Utilize a moving average in the calculation for smoother and more accurate trend identification.
- Pay attention to overbought and oversold conditions highlighted by the oscillator to identify potential market reversals.
- Anticipate trend shifts by looking for divergence between price action and the Stochastic Oscillator readings.
- Enhance trading signals by using the Stochastic Oscillator in conjunction with other indicators for comprehensive analysis.
Can I Use the Stochastic Oscillator Indicator for Trading Strategies?
Yes, you can use the Stochastic Oscillator indicator for trading strategies. Here are some tips for stochastic oscillator signals. When the indicator crosses below 20, it can be a buy signal. Conversely, when it crosses above 80, it can be a sell signal. Use these tips to enhance your trading strategies.
What Are the Common Mistakes in Calculating Stochastic Oscillator Indicator?
When calculating the Stochastic Oscillator indicator, it’s important to avoid common mistakes that can skew results. One of the best methods for stochastic oscillator calculation is to ensure that the correct closing price data is used, and to avoid using erroneous data that can lead to inaccurate readings.
Frequently Asked Questions
How Do You Calculate the Stochastic Indicator?
To calculate the stochastic indicator, compare the current closing price to the highest high and lowest low over a specific period. Derive %K by subtracting the lowest low, dividing by the total range, and multiplying by 100. %D is a 3-day SMA of %K for smoother readings.
What Is the Best Indicator With Stochastic Oscillator?
For the best indicator with the Stochastic Oscillator, consider the Relative Strength Index (RSI). This pairing is a popular choice among traders for a comprehensive analysis, providing valuable insights into market momentum and potential reversals.
What Is 5 3 3 Stochastic Settings?
In 5 3 3 stochastic settings, you utilize a 5-period %K, 3-period %D, and a 3-period smoothing factor. This configuration, a rapid variant of Stochastic Oscillator, hones in on short-term price actions, offering swift market insights.
What Is Stochastic 14 3 3?
Stochastic 14 3 3 is a configuration with a 14-day calculation for %K line, 3-day SMA for %D line, and 3-day smoothing factor. It offers a balanced approach to interpreting momentum in trading analysis.
Conclusion
In conclusion, mastering the calculation and interpretation of the Stochastic Oscillator indicator is crucial for successful trading. By understanding historical developments, interpreting readings accurately, and applying it effectively in various markets, you can maximize your trading potential.
Remember, the Stochastic Oscillator is a powerful tool that can help you identify trends and reversals, leading to profitable trading decisions. Embrace the complexity of this indicator, and watch your trading skills soar to new heights.