
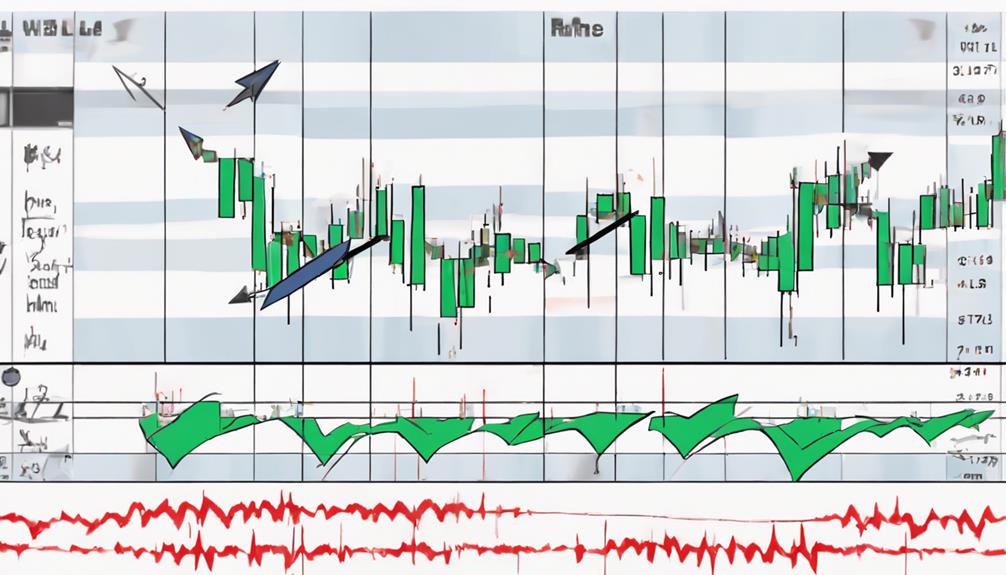
In technical analysis software, candlestick patterns serve as crucial tools for interpreting market behavior. As you navigate through price charts, the intricate formations of these candlesticks can reveal valuable insights into potential price movements.
Understanding how to identify and interpret these patterns can provide you with a competitive edge in your trading endeavors. By recognizing the significance of various candlestick formations, you can unlock a deeper understanding of market dynamics and potentially enhance your trading strategies.
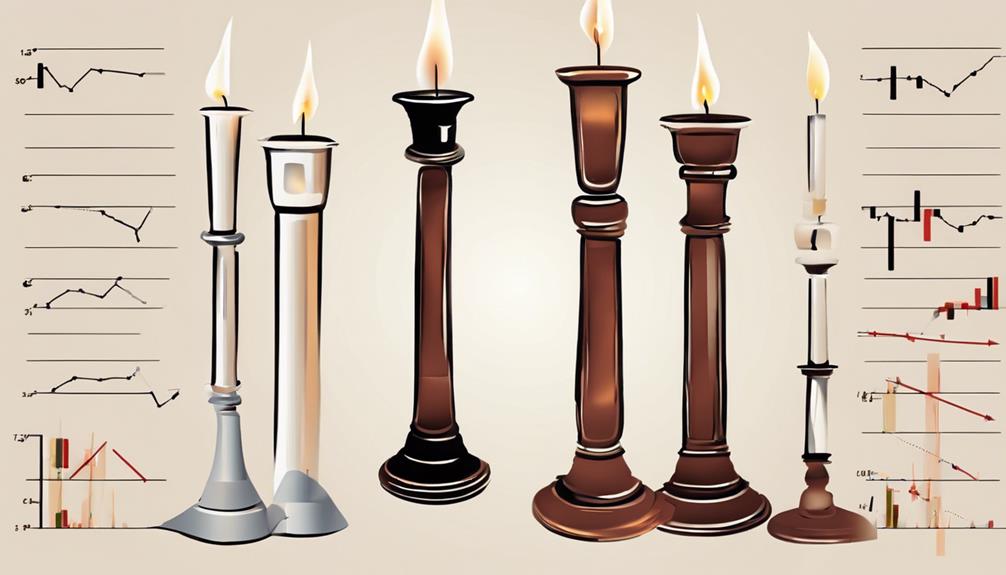
Understanding Candlestick Pattern Basics
To grasp the fundamentals of candlestick patterns, consider them as visual representations of daily price movements in financial markets. These patterns, whether bullish or bearish, provide insight into potential price trends and reversals.
The body of a candlestick represents the opening and closing prices, while the wicks show the high and low prices for a specific period. For instance, an engulfing pattern occurs when one candle's body completely covers the previous candle's body, suggesting a possible trend reversal.
Identifying Reversal Candlestick Patterns
Understanding reversal candlestick patterns is crucial for traders seeking to anticipate potential trend changes in the market. Reversal patterns such as the Evening Star, Three Black Crows, and Dark Cloud Cover signify a potential change in market direction from bullish to bearish or vice versa.
These candlestick patterns are key tools in technical analysis, helping traders gauge market sentiment and identify possible price reversals. It's essential to wait for confirmation through subsequent price action before acting on these signals.
Exploring Continuation Candlestick Patterns
Exploring Continuation Candlestick Patterns reveals key insights into the persistence of current market trends without signaling a reversal. These continuation patterns, such as Doji, Spinning Top, and Falling Three Methods, indicate market rest or indecision rather than a potential reversal in price movements.
Traders rely on these patterns to anticipate ongoing market trends and make informed decisions about their existing trades. By recognizing these candlestick patterns, traders can better understand the market dynamics and differentiate between temporary pauses in the trend and actual trend reversals.
Continuation patterns play a crucial role in helping traders navigate the complexities of market behavior and adjust their strategies accordingly to stay aligned with the prevailing trend.
Implementing Candlestick Patterns in Analysis
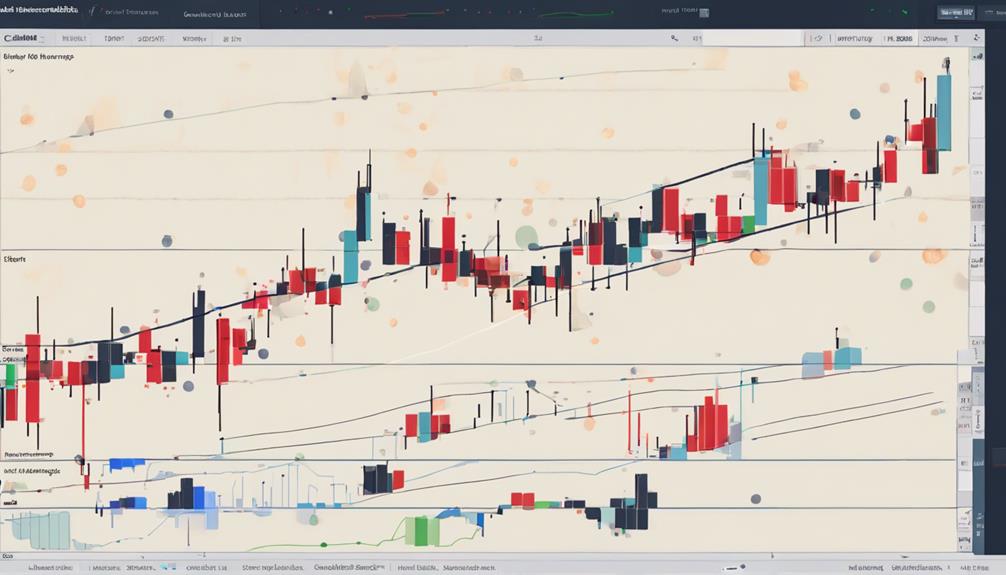
Implement candlestick patterns effectively by analyzing price movements and recognizing specific formations to inform your trading decisions accurately.
When an engulfing pattern occurs, such as a bullish engulfing line or bearish engulfing pattern, it signals potential reversals in the market.
The hanging man pattern suggests a reversal from an uptrend to a downtrend, while the Spinning Top Candlestick indicates indecision between buyers and sellers.
Recognizing the hammer candlestick pattern can signal a potential bullish reversal. Additionally, patterns like the Head and Shoulders can provide insights into trend reversals.
Leveraging Candlestick Patterns for Trading Success
To maximize your trading success, harness the power of candlestick patterns to gain valuable insights into market dynamics and make well-informed decisions. Japanese Candlestick Charting Techniques offer a range of patterns like the bearish engulfing line, bullish engulfing pattern, long green candle, long red candle, piercing line, inverted hammer, morning star, and evening star, indicating potential trend reversals. Understanding these patterns aids in predicting future price movements with more accuracy.
Successful traders look for these patterns as signals to enter or exit trades, particularly when confirmed by subsequent candles. By incorporating these patterns into your trading strategy, you can enhance your ability to capitalize on market opportunities and manage risks effectively.
How Can I Use Candlestick Patterns to Make Informed Decisions in Technical Analysis Software?
Candlestick patterns in technical analysis can help traders make better decisions. By recognizing patterns like Doji, Hammer, or Engulfing, users can predict potential market reversals or continuations. This information can be used in technical analysis software to inform trading strategies and make more informed investment decisions.
Frequently Asked Questions
What Is a Candlestick Pattern in Technical Analysis?
To understand a candlestick pattern in technical analysis, recognize it as a visual depiction of price movements. Utilize these patterns for predicting market shifts and spotting trend changes or continuations. Enhance your trading decisions by integrating them with technical tools.
What Is Candlestick for Data Analysis?
In data analysis, candlesticks represent trends and patterns in numerical data. They visualize fluctuations in values over time, aiding in identifying anomalies and predicting future movements. Understanding candlesticks is crucial for making informed decisions based on data insights.
What Is the AI Tool for Candlestick Patterns?
You can harness the power of AI to uncover intricate candlestick patterns swiftly. This tool swiftly scans data, delivering real-time alerts and customizable options. It's a game-changer, simplifying pattern recognition for your trading strategies.
What Are Called Candlestick Pattern?
Identifying candlestick patterns is crucial in trading. They signal potential market shifts based on price chart formations like Doji or Engulfing Patterns. Recognizing these shapes empowers traders to make informed decisions, predicting market directions and optimizing entry/exit points.
Conclusion
In conclusion, mastering candlestick patterns in technical analysis software is crucial for successful trading. By recognizing these patterns and understanding their implications, you can make informed decisions and improve your trading strategies.
Remember, just like a skilled artist uses different brushstrokes to create a masterpiece, traders use candlestick patterns as tools to navigate the complex world of financial markets.
Keep honing your skills and watch your trading success grow like a beautiful painting coming to life.