
You may not realize that RSI, or the Relative Strength Index, is a powerful tool for generating trading signals in the financial markets.
By following five key steps, you can effectively use RSI to make informed decisions and potentially improve your trading outcomes. From identifying high and low points to implementing stop-loss strategies, each step plays a crucial role in your trading success.
Understanding how to leverage RSI signals could be the missing piece in your trading strategy puzzle.
Identifying High/Low Points
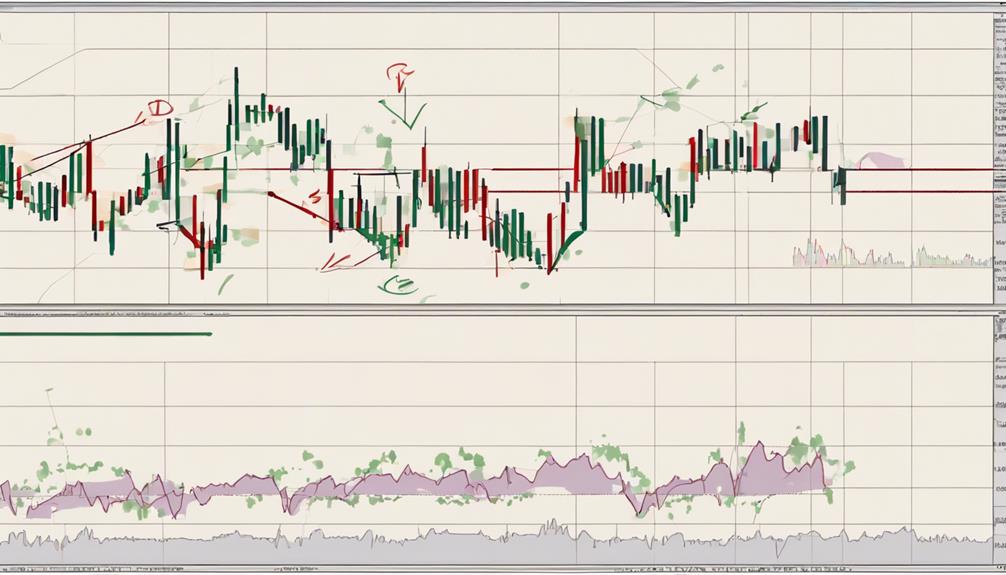
To effectively identify high and low points in the Relative Strength Index (RSI), you must closely monitor RSI values to recognize potential overbought or oversold conditions in the market. High points in RSI, typically above 70, signal potential overbought conditions, while low points below 30 suggest potential oversold conditions. Being aware of RSI extremes allows you to anticipate potential price reversals or corrections.
Additionally, keeping an eye on RSI levels near 50 can offer insights into market momentum shifts. Recognizing these high and low points is crucial as they're instrumental in generating buy or sell signals in your trading strategies. By understanding these dynamics, you can enhance your ability to make informed trading decisions based on RSI indicators.
Utilizing RSI Indicator Signals
When utilizing RSI indicator signals, traders can effectively gauge market conditions to make informed buy or sell decisions based on key thresholds and market momentum shifts. RSI signals above 70 indicate overbought conditions, suggesting a potential price decline, while signals below 30 indicate oversold conditions, hinting at a potential price increase.
Crossing the 50 level can delineate bullish and bearish market territories, aiding in trade decisions. Buy signals are typically generated when RSI crosses above 50, and sell signals when it crosses below 50. Combining RSI signals with other technical indicators can enhance trading accuracy and decision-making, providing a more comprehensive view of market conditions for traders to act upon.
Waiting for Confirmation Candle

Transitioning from assessing RSI indicator signals, traders depend on confirmation candles to validate the indicated market conditions before executing trading decisions. A confirmation candle acts as a crucial component in confirming RSI signals, ensuring the accuracy of trading signals.
By waiting for this confirmation, traders can reduce false signals and enhance the reliability of their trading strategies. The confirmation candle essentially validates the RSI signal by closing in alignment with the direction indicated by the RSI reading.
This validation step is essential for avoiding premature entries or exits, leading to more informed and strategic trading decisions based on the combination of RSI signals and confirmation candles.
Incorporating confirmation candles into the trading process significantly improves the overall quality and effectiveness of trading strategies.
Entering the Trade
After confirming the RSI signal with a confirmation candle, you're now ready to enter the trade based on specific criteria. When entering the trade with RSI, consider the following:
- Look for RSI crossing above 30 for a potential buy opportunity in an oversold market.
- Confirm a bullish trend when RSI moves from below 30 to above 30.
- Identify entry points by observing RSI crossing above 30 and price confirming the reversal with upward movement.
- Consider entering a trade as RSI crosses below 70, indicating a potential sell opportunity in an overbought market.
- Use RSI signals alongside other technical indicators to validate trade entries effectively.
What Are the Essential Steps for Using RSI to Generate Trading Signals?
When looking to interpret RSI movements, steps should be taken to generate accurate trading signals. Start by identifying the overbought and oversold levels, then observe for divergences between price and RSI. Next, wait for the RSI to move in the opposite direction of the price trend before making any trade decisions.
Implementing Stop Loss
To effectively manage risk and protect your capital while trading, the implementation of stop loss orders is a crucial step in your strategy. Stop loss orders are set at specific price levels on the asset's chart to automatically close a trade and limit potential losses.
These levels are often determined based on support and resistance levels, considering the volatility of the asset to account for price fluctuations. By utilizing stop loss orders, you can effectively manage risk by ensuring that your trades are automatically exited if the price moves against your position, helping you protect your capital and minimize potential losses in the market.
It's an essential tool for any trader looking to navigate the uncertainties of trading successfully.
Frequently Asked Questions
What Is the RSI 5 Strategy?
The RSI 5 strategy involves utilizing a 5-period RSI for shorter-term trading signals. It focuses on quicker price action analysis and faster responses to market changes. Traders adjust risk management to match the shorter timeframe.
What Is the RSI 3 Strategy?
You want to master the RSI 3 strategy for fast trading signals. It focuses on quick momentum changes, ideal for day traders. Expect more signals but also more noise. Combine with other indicators for confirmation.
What Is the RSI 50 50 Strategy?
When using the RSI 50 50 strategy, aim to leverage RSI levels to gauge market sentiment. Above 50 signals bullish trends, while below 50 indicates bearish movements. This straightforward strategy is commonly enhanced by combining RSI with other indicators for more precise signals.
What Is the Best RSI Strategy?
In the realm of trading, the best RSI strategy hinges on pinpointing overbought and oversold conditions. Levels above 80 signal overbought, while below 20 indicate oversold markets. It's crucial for capturing medium-term trend changes effectively.
Conclusion
After following the five key steps to generate trading signals with RSI, you're now equipped to make informed decisions in the market.
For example, by identifying RSI divergence and combining it with MACD, you can enhance your trading strategy for higher accuracy.
Remember to always implement stop loss to manage risk effectively and maximize your potential profits.
Keep analyzing, adjusting, and refining your approach to stay ahead in the trading game.