
Imagine navigating through the intricate layers of the Ichimoku Cloud indicator, each component like a piece of a puzzle waiting to reveal the market's next move. As you explore the Tenkan-sen, Kijun-sen, and the dynamic interplay of Senkou Span A and B, the path to mastering this powerful tool starts to unfold before you.
Stay tuned to uncover invaluable tips that will elevate your understanding and utilization of the Ichimoku Cloud indicator, propelling your trading strategies to new heights.
Understanding Ichimoku Cloud Components
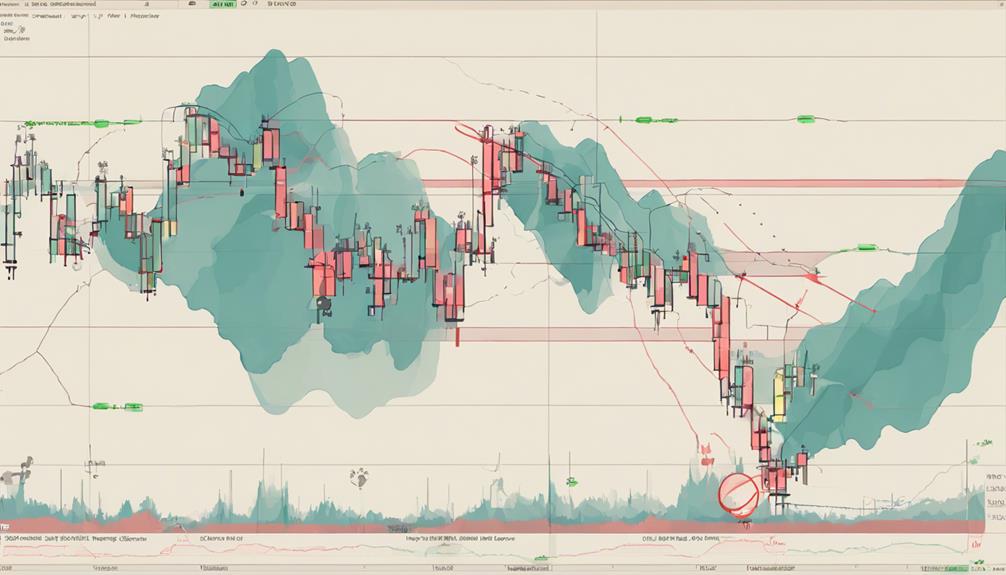
Understanding the components of the Ichimoku Cloud involves analyzing various indicators that provide insight into short-term momentum, medium-term trend direction, and support and resistance levels within the market. One crucial element is the Senkou Span B, calculated over 52 periods, which forms the upper boundary of the cloud. This component assists in identifying potential future areas of support or resistance.
By understanding the Senkou Span B, traders can gauge the strength of the trend and potential price reversals. Monitoring this upper cloud boundary can offer valuable information for making informed trading decisions.
Incorporating the Senkou Span B into your analysis of the Ichimoku Cloud Indicator can provide a comprehensive view of market dynamics, enhancing your ability to navigate the complexities of trading effectively.
Interpreting Tenkan Sen and Kijun Sen
When analyzing Tenkan Sen and Kijun Sen, it's crucial to pay close attention to their crossovers as they hold significant implications for potential trend changes.
Consider the timeframe you're analyzing as it can influence the reliability of signals provided by these lines.
Understanding the signals generated by these lines can aid in identifying optimal entry and exit points within your trading strategy.
Line Crossovers Significance
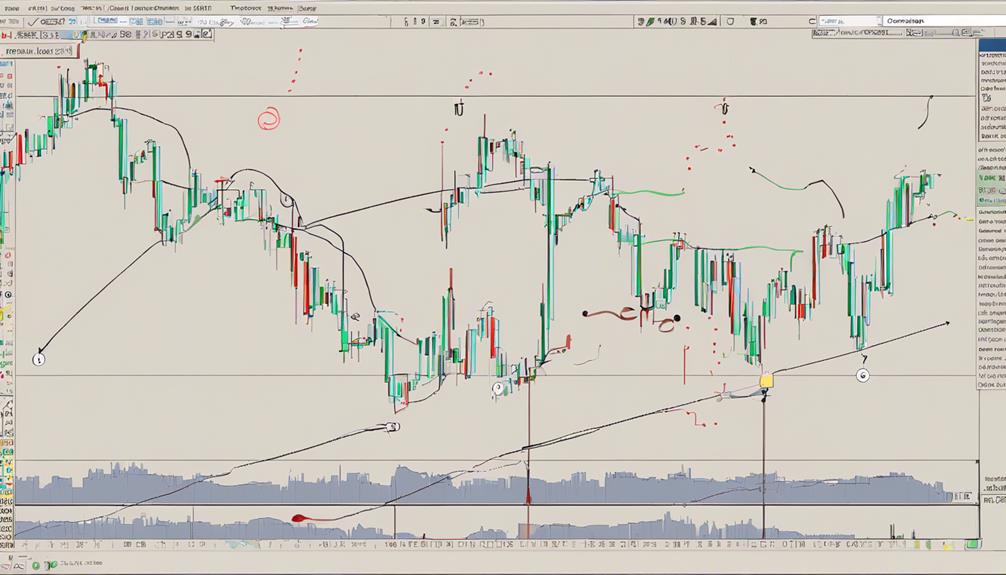
The significance of interpreting Tenkan Sen and Kijun Sen line crossovers lies in their ability to indicate potential trend changes in market analysis. When the Tenkan Sen crosses above the Kijun Sen, it signals a bullish trend, suggesting a potential buying opportunity. Conversely, if the Tenkan Sen crosses below the Kijun Sen, it indicates a bearish trend, signaling a potential selling opportunity.
Traders often use these crossovers to confirm entry and exit points in their trading strategies, aiming to capitalize on market movements. By monitoring the frequency and direction of these line crossovers, traders can better understand market sentiment and make well-informed decisions. Understanding the significance of these crossovers is crucial for effectively utilizing the Ichimoku Cloud indicator in technical analysis.
Timeframe Considerations for Analysis
Considering multiple timeframes is crucial when interpreting the Tenkan Sen and Kijun Sen for accurate trend analysis in the Ichimoku Cloud indicator. The Tenkan Sen, calculated over 9 periods, focuses on short-term trends within the analyzed timeframe, while the Kijun Sen, computed over 26 periods, highlights medium-term trends and aids in assessing price momentum.
To enhance your analysis, it's essential to look at the interaction between these lines across various timeframes. Here are some key points to keep in mind:
- Confirm trends by analyzing both Tenkan Sen and Kijun Sen in multiple timeframes.
- Understand the distinct roles of Tenkan Sen and Kijun Sen in trend analysis.
- Pay attention to crossovers between Tenkan Sen and Kijun Sen on different timeframes.
- Use specific timeframe dynamics to improve the accuracy of your Ichimoku Cloud indicator analysis.
Signals for Trend Changes
To effectively interpret trend changes using the Tenkan Sen and Kijun Sen in the Ichimoku Cloud indicator, observe how crossovers signal potential shifts in market direction. When the Tenkan Sen crosses above the Kijun Sen, it suggests a potential bullish trend change, while a bearish trend change is indicated by the Tenkan Sen crossing below the Kijun Sen.
Additionally, the angle and separation between the Tenkan Sen and Kijun Sen can provide insights into trend strength. Traders often utilize these crossovers to pinpoint entry and exit points in their trading strategies.
Understanding the dynamics between the Tenkan Sen and Kijun Sen is essential for accurately interpreting trend changes and making informed decisions based on the signals generated by these indicators.
Analyzing Senkou Span A and Senkou Span B
When analyzing Senkou Span A and Senkou Span B, focus on their individual calculations and interpretations.
Senkou Span A's average of the Tenkan-sen and Kijun-sen sets the lower boundary, while Senkou Span B's midpoint of the highest high and lowest low over 52 periods establishes the upper boundary.
The relationship and distance between these two spans provide insight into the potential trend strength and direction.
Span A Calculation
Span A Calculation, a fundamental aspect in analyzing Ichimoku Cloud indicators, involves deriving the average of Tenkan-sen and Kijun-sen to determine critical support levels and assess market trend equilibrium. Understanding Senkou Span A is crucial for interpreting the lower boundary of the cloud in the Ichimoku indicator. By analyzing Senkou Span A, traders can gain insights into potential support levels in the market and evaluate the balance between short-term and medium-term trends effectively. Changes in Senkou Span A relative to Senkou Span B can signal shifts in market sentiment and trend strength, providing valuable information for making informed trading decisions.
- Senkou Span A is calculated as the average of Tenkan-sen and Kijun-sen.
- It forms the lower boundary of the cloud structure in the Ichimoku indicator.
- Senkou Span A provides insights into potential support levels in the market.
- Analyzing Senkou Span A helps traders gauge the equilibrium between short-term and medium-term trends.
Span B Interpretation
Deriving crucial insights into market sentiment and trend strength, analyzing Senkou Span A and Senkou Span B in Ichimoku Cloud analysis is imperative for making informed trading decisions.
Senkou Span B, calculated using the midpoint of the last 52 price bars, forms the upper boundary of the cloud structure. It plays a vital role in predicting future price movement and assessing trend robustness.
By examining the relationship between Senkou Span A and B, traders can better understand market sentiment. Senkou Span B aids in pinpointing potential support and resistance levels, offering valuable guidance for strategic trading moves.
Mastery of Senkou Span B interpretation enhances your ability to anticipate market dynamics and optimize trading strategies in Ichimoku Cloud analysis.
Utilizing Chikou Span for Lagging Signals
To harness the power of Chikou Span for lagging signals, traders assess its position relative to historical prices to validate trend strength and potential reversals. When utilizing Chikou Span in your analysis, consider the following:
- Compare Chikou Span's position with historical prices to confirm trend direction.
- Look for Chikou Span crossing price action as a potential signal of trend reversal.
- Use Chikou Span to identify support and resistance levels based on past price action.
- Analyze Chikou Span's momentum by observing its location in relation to historical prices.
Mastering Kumo Cloud Interpretation
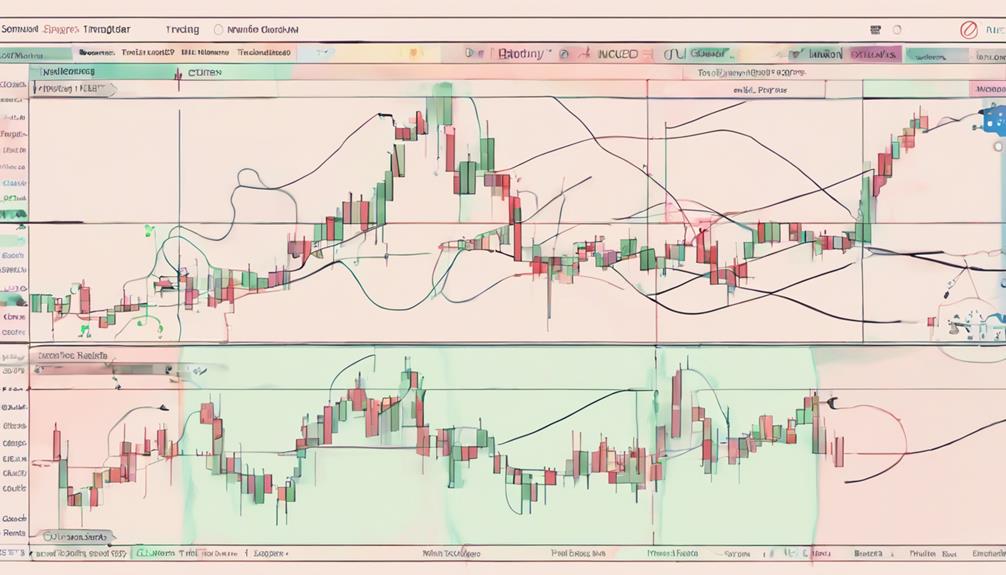
To truly grasp the nuances of Ichimoku Cloud analysis, understanding the intricate dynamics of the Kumo Cloud and its interplay with price movements is essential.
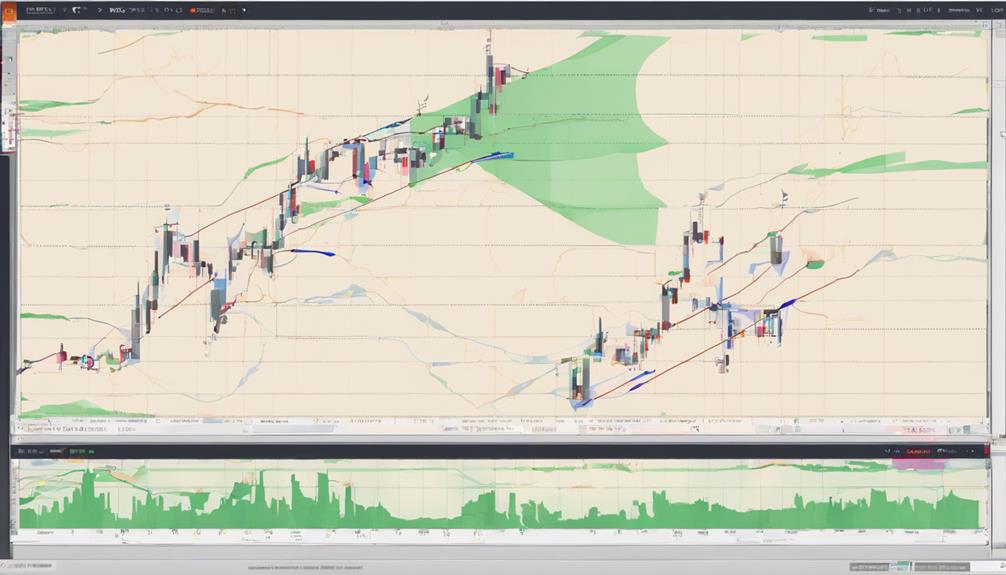
The Kumo Cloud, comprising Senkou Span A and Senkou Span B, establishes dynamic support and resistance levels. This cloud's color changes based on the relationship between these spans, reflecting market sentiment – green for bullish and red for bearish conditions.
Mastering Kumo Cloud interpretation involves analyzing how price interacts with the cloud boundaries to confirm trends effectively. By recognizing the Kumo Cloud's role in identifying critical support and resistance levels, traders can gain insights into potential market direction shifts.
Through careful observation and analysis, you can leverage the Kumo Cloud's insights to enhance your Ichimoku analysis skills.
Identifying Trend Reversals With Ichimoku
When identifying potential trend reversals with Ichimoku analysis, observe for crucial signals such as Senkou Span A crossing below Senkou Span B as an indicator of a bearish trend shift. To further confirm trend reversals, look for Chikou Span crosses above or below historical price action.
Additionally, pay attention to price movements crossing above or below the Kumo cloud, which can signal potential trend changes. Utilize the Kijun-Sen line as a key indicator for confirming trend reversals.
Setting Entry and Exit Points
When setting entry and exit points in your trading strategy, you must prioritize entry signals' importance and plan your exit strategies meticulously.
Timing your trade execution based on Ichimoku Cloud indicators requires strategic thinking and precision.
Utilize the data-driven approach of Ichimoku analysis to optimize your entry and exit points effectively.
Entry Signals Importance
Mastering the timely identification of entry points based on Tenkan-sen/Kijun-sen crossovers is crucial for effective trading strategies. When setting entry signals, consider the following:
- Confirm entry signals with other technical indicators like MACD or RSI for higher accuracy.
- Utilize Chikou Span to assess current price momentum and validate entry/exit decisions.
- Effective entry signal selection enhances trading success and risk management strategies.
- Exit points should be determined using support/resistance levels identified by Senkou Span A and B.
Exit Strategies Planning
Effective exit strategies planning in Ichimoku analysis involves setting entry and exit points based on the position of the price relative to the Cloud and utilizing Chikou Span to confirm signals through past price action comparison.
When determining exit points, consider support and resistance levels indicated by Senkou Span A and B. These levels can act as barriers where price movements may stall or reverse, making them crucial for planning exits.
Additionally, incorporating trailing stop-loss orders can help secure profits as the price progresses favorably. To adapt to changing market conditions, adjust exit points dynamically based on the strength of the trend revealed by Ichimoku Cloud components.
Timing Trade Execution
To enhance the precision of your trading decisions in Ichimoku analysis, strategically timing trade execution by setting entry and exit points is crucial. When considering the Tenkan-sen and Kijun-sen crossovers, you can effectively determine entry points for timely trade execution.
Additionally, the Senkou Span A and B can assist in identifying optimal exit points aligned with the trend's strength. Confirming signals for both entry and exit can be further supported by evaluating the position of the Chikou Span relative to the price.
Lastly, leveraging historical price data in conjunction with the Ichimoku Cloud can aid in refining your entry and exit strategies, while integrating candlestick patterns can further enhance the precision of your trade timing.
Applying Ichimoku Cloud for Scalping
When scalping with the Ichimoku Cloud indicator, focus on short-term price movements and utilize fast-paced trading strategies with quick entries and exits. The Ichimoku Cloud can help you identify short-term trends and potential entry points for scalping. Look for clear signals such as Tenkan-sen/Kijun-sen crossovers for profitable scalping opportunities.
It's crucial to adapt the Ichimoku Cloud settings for faster timeframes to suit your scalping strategies effectively. By staying attuned to these short-term trends and making rapid decisions based on the Ichimoku Cloud signals, you can enhance your chances of success in scalping.
Remember to maintain discipline and follow your trading plan closely to maximize the benefits of using the Ichimoku Cloud indicator for scalping.
Combining Ichimoku With Other Indicators
Combining Ichimoku Cloud with complementary indicators such as RSI or MACD enhances the confirmation of trend signals in technical analysis. By integrating other indicators with Ichimoku Cloud analysis, you can validate breakout levels more effectively and improve trade accuracy.
Seeking alignment between Ichimoku Cloud signals and other technical tools is crucial for making well-informed decisions. Additionally, incorporating Fibonacci levels into your Ichimoku Cloud analysis can offer valuable support and resistance insights.
Utilizing chart patterns alongside Ichimoku Cloud can provide a comprehensive view for strategic decision-making. When combining Ichimoku with other indicators, ensure that there's a cohesive relationship between the signals to strengthen your trading strategies.
Practical Tips for Effective Ichimoku Analysis
Integrating Ichimoku Cloud into your daily trading routine is essential for honing your analysis skills effectively. By incorporating Ichimoku into your trading routine, you ensure consistency in your approach, leading to more informed decisions.
Utilize historical data to backtest Ichimoku strategies, enhancing accuracy and confidence in your trades. Stay updated on market conditions to adapt your Ichimoku analysis accordingly, keeping your strategies relevant.
Implement stop-loss orders based on Ichimoku support levels to manage risks effectively. Understanding how Ichimoku defines support and resistance levels can significantly improve your trading decisions, providing clear guidance on entry and exit points.
How Can I Master the Use of Ichimoku Cloud Indicator for Analysis?
Mastering the art of technical analysis can be challenging, but using Ichimoku Cloud indicator can provide valuable insights into market trends. By understanding the components and interpretations of using Ichimoku Cloud indicator, traders can make more informed decisions and improve their overall analysis skills.
Frequently Asked Questions
What Is the Best Indicator for Ichimoku Cloud?
The best indicator for Ichimoku Cloud is the Chikou Span. It compares current and past prices, confirming trends and helping you pinpoint entry or exit points. Understanding its role is crucial for mastering Ichimoku analysis.
What Is the Best Timeframe for Ichimoku?
For mastering Ichimoku analysis, focus on the daily timeframe for medium to long-term trades. Shorter frames like 1-hour or 4-hour suit intraday trading. Longer frames like weekly or monthly offer reliable trend signals. Use multiple frames for confirmation.
What Are the Best Settings for Ichimoku Cloud?
For Ichimoku Cloud, the best settings depend on your trading style and goals. Experiment with different configurations to find what works best for you. Backtesting various setups is crucial for determining their effectiveness.
How Accurate Is Ichimoku Cloud Indicator?
In trading, the accuracy of the Ichimoku Cloud indicator varies. Combining it with other tools can enhance accuracy. Understanding its strengths and limitations is crucial for optimization. Consistent practice and observation are key for mastery.
Conclusion
In conclusion, mastering the Ichimoku Cloud indicator analysis requires dedication, practice, and a solid understanding of its components.
Remember, 'practice makes perfect' when it comes to utilizing this powerful tool in your trading strategy.
Keep refining your skills, adapting to market conditions, and staying disciplined in your approach.
With time and effort, you can become proficient in interpreting the Ichimoku Cloud and making informed trading decisions.