
Standard Deviation serves as a powerful lens through which market dynamics come into focus, shedding light on crucial aspects that impact decision-making. From unraveling market volatility patterns to deciphering trends and assessing risks, Standard Deviation plays a pivotal role in market analysis.
By understanding how this statistical measure can uncover valuable insights, investors gain a strategic edge in navigating the complexities of financial landscapes. As we explore the multifaceted ways in which Standard Deviation illuminates market analysis, a deeper comprehension of its implications unfolds, offering a clearer perspective on market behavior and informing prudent investment strategies.
Importance of Standard Deviation in Market Analysis
In market analysis, the importance of standard deviation lies in its ability to quantitatively measure the degree of price fluctuations around the average, providing crucial insights into market volatility.
Standard deviation serves as a key tool in technical analysis, helping traders assess the level of risk associated with different investments. When standard deviation is low, it indicates that the data points are close to the average, suggesting a more stable market with less price fluctuation.
On the other hand, high standard deviation points to significant variability from the mean, signaling higher market volatility and potential risk. Understanding these concepts is vital for investors as they use standard deviation to make informed decisions, adjust trading strategies, and manage risks effectively.
Volatility Insights From Standard Deviation
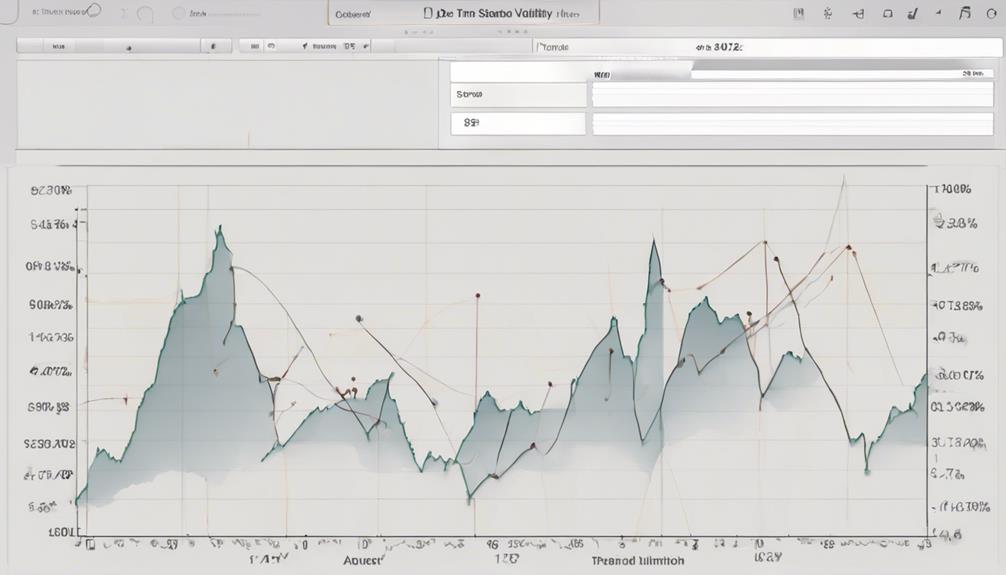
An essential aspect of market analysis, standard deviation offers valuable insights into price volatility by quantifying the dispersion of prices from the average.
Volatility Insights from Standard Deviation:
- Market Volatility: Standard deviation is a key metric for assessing market volatility. High standard deviation values indicate increased market volatility with significant price fluctuations, while low values suggest a more stable market environment.
- Price Fluctuations: Traders use standard deviation to gauge the extent of price fluctuations within a market. Understanding the level of price dispersion around the mean helps in anticipating potential market movements and adjusting trading strategies accordingly.
- Risk Assessment: Standard deviation plays a crucial role in risk assessment for investments. Higher volatility, as indicated by larger standard deviations, implies a higher degree of uncertainty and the potential for more substantial price swings. Traders rely on standard deviation to evaluate and manage the risks associated with varying levels of market volatility.
Identifying Market Trends With Standard Deviation
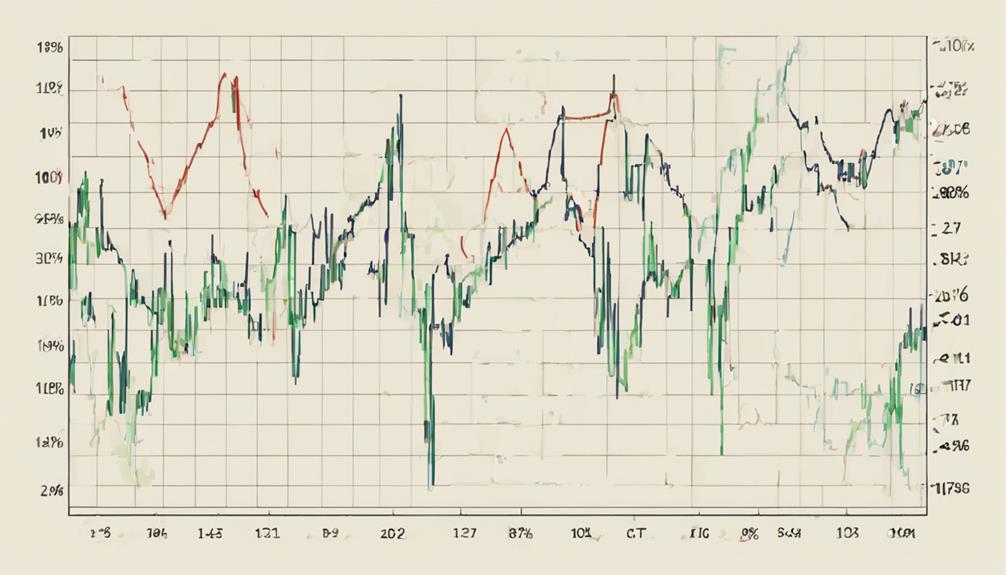
Standard deviation serves as a fundamental tool for identifying market trends by quantifying the volatility of price movements around the average. By calculating the standard deviation, traders and investors can gain valuable insights into the level of volatility in the market.
When the standard deviation is low, it indicates that there is low volatility in the market, suggesting that the current trend is likely to continue. This stability in price movements can help market participants confirm the direction of the trend and make informed decisions based on this information.
On the other hand, high standard deviation values suggest increased market volatility, which could signal potential trend changes or reversals. Therefore, analyzing standard deviation over different time periods can provide a comprehensive view of the strength and sustainability of market trends, enabling traders to adapt their strategies accordingly.
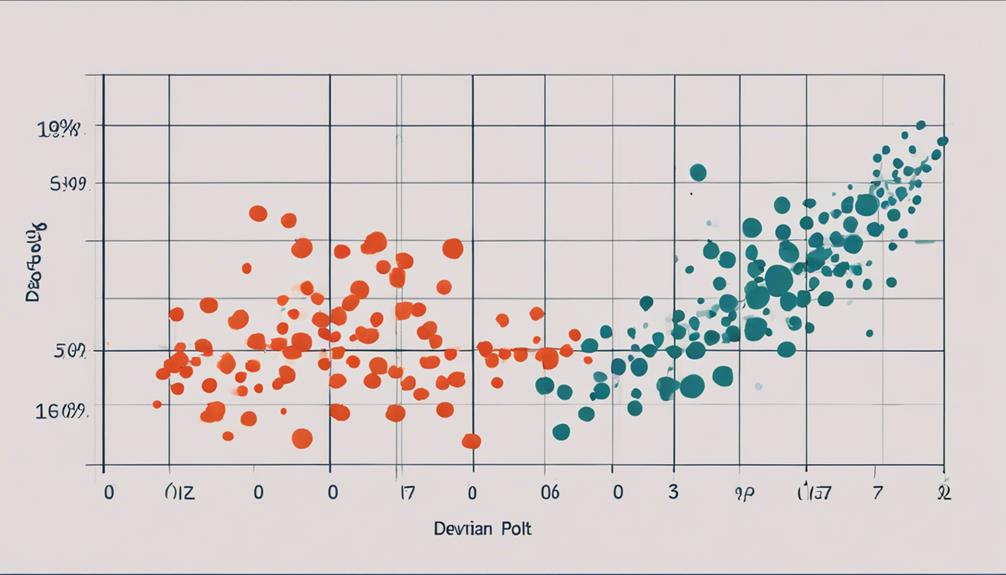
Risk Assessment Using Standard Deviation

Utilizing standard deviation as a metric for risk assessment provides investors with a quantitative measure of the volatility and uncertainty associated with an investment. Here are three key points to consider when using standard deviation for risk assessment:
- Dispersion of Returns: Standard deviation measures the extent to which returns deviate from the average, giving insight into the level of volatility present in an investment. Higher standard deviation values indicate greater fluctuations in returns, signaling higher risk associated with the investment.
- Risk Evaluation: Investors can use standard deviation to assess the historical performance of an asset and gauge the potential future fluctuations in returns. By understanding the level of volatility through standard deviation, investors can make more informed decisions regarding risk management strategies.
- Portfolio Management: Standard deviation is a fundamental tool in portfolio management, enabling investors to diversify their holdings based on their risk tolerance and desired returns. By incorporating standard deviation analysis, investors can optimize their asset allocation to achieve a balance between risk and return.
Enhancing Decision-Making With Standard Deviation
Enhancing decision-making in market analysis through the utilization of standard deviation provides investors with a precise quantitative measure of volatility and risk associated with their investments. By calculating standard deviation, investors can gauge the extent of price variability from the average price of an asset.
Understanding that standard deviation is the square root of variance allows for a clearer interpretation of the data. Incorporating standard deviation alongside other technical indicators can offer a comprehensive view of market conditions. For instance, when standard deviation is high, it indicates a wider trading range and higher risk, prompting investors to adjust their strategies accordingly.
Conversely, a narrow trading range implies lower volatility and risk. Utilizing standard deviation to enhance decision-making enables investors to make more informed choices, manage risks effectively, and optimize their investment outcomes by adapting to market fluctuations in a timely manner.
How Does Standard Deviation Help with Market Analysis in Trading?
Standard deviation is a crucial metric in trading with standard deviation applications. It helps traders evaluate the volatility of an asset’s price movements. By understanding the range of price fluctuations, traders can make more informed decisions about potential risks and rewards in the market.
Frequently Asked Questions
How Is Standard Deviation Used in Marketing?
Standard deviation in marketing is utilized to assess the variability of data points around the mean, offering insights into metric consistency or dispersion. Marketers leverage this measure to gauge risk, identify outliers, trends, and optimize campaign strategies.
How Standard Deviation Is Used in the Stock Market?
Standard deviation in the stock market is utilized to gauge price volatility, assisting investors in evaluating risk levels associated with individual securities or portfolios. It aids in decision-making by highlighting price variability and informing entry and exit strategies.
How Is Standard Deviation Used in Data Analysis?
Standard deviation is a statistical tool that measures the dispersion of data points from the mean, aiding in assessing variability and uncertainty. It is crucial in data analysis for understanding patterns, trends, and making informed decisions based on data fluctuations.
How Do You Use Standard Deviation Indicator in Trading?
The Standard Deviation indicator in trading is utilized to measure price volatility, assess market sentiment, identify trend reversals, set stop-loss levels, and enhance risk management strategies. Its calculation provides valuable insights for informed decision-making.
Conclusion
In conclusion, standard deviation plays a crucial role in illuminating market analysis. It provides valuable insights into price volatility, trend identification, risk assessment, and decision-making.
For example, in a case study of stock market analysis, standard deviation helped investors assess the level of risk associated with different portfolios. This information enabled them to make informed decisions based on the variability of stock prices.
This analytical tool is essential for understanding market behavior and making strategic investment choices.