
When navigating the complexities of trading, think of the ADL indicator as a compass guiding you through the market terrain. Understanding how to effectively utilize this tool can greatly impact your decision-making process.
By implementing five practical tips tailored to harnessing the power of the ADL indicator, you can enhance your trading strategies and potentially unlock new opportunities in the ever-changing landscape of the financial markets.
Stay tuned to discover how these tips can elevate your trading game and lead you towards more profitable outcomes.
Understanding ADL Indicator Basics
To grasp the essence of the ADL indicator, you must understand its fundamental purpose in evaluating market breadth by comparing advancing and declining stocks on a cumulative basis.
The Accumulation Distribution Indicator (ADL) is a technical tool that reflects market sentiment and changes in market breadth based on price movements. By tracking the net advances added to the previous ADL value, this indicator provides essential insights into the quality of trends.
The ADL chart's direction and slope play a crucial role in determining bullish or bearish sentiment concerning the price index. Leveraging the ADL indicator can aid in confirming trends, identifying potential reversals, and generating trading signals through a comprehensive analysis of market breadth.
Interpreting ADL Indicator Trends
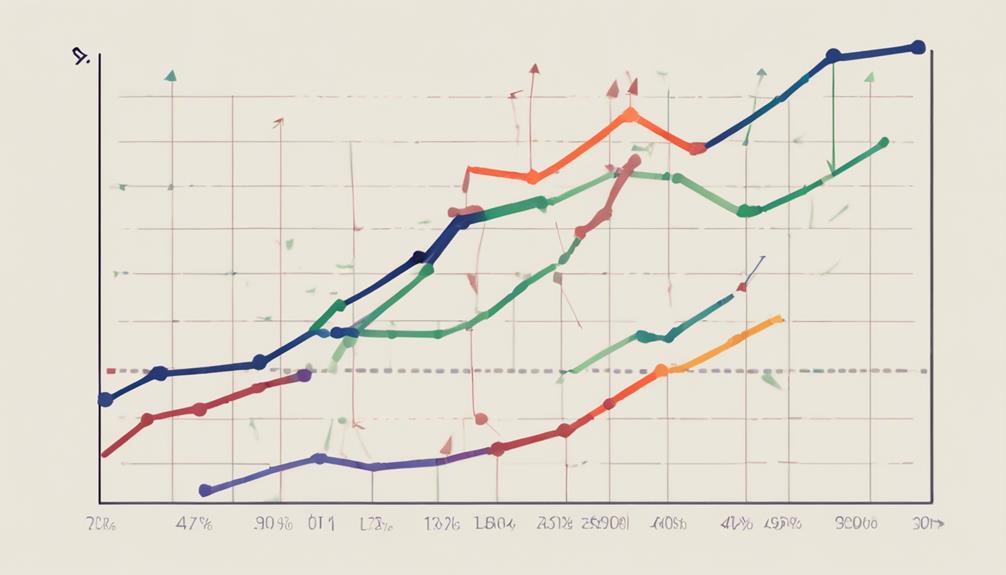
Interpreting ADL Indicator Trends requires a keen eye for identifying shifts in market sentiment through analyzing the accumulation and distribution of stock movements. When observing the ADL indicator, pay attention to trends such as upward movements signaling positive market breadth and downward trends indicating negative sentiment.
The slope of the ADL line can offer insights into the strength and direction of market trends, aiding in making informed trading decisions. Additionally, confirming price movements with ADL trends is crucial for assessing the quality of the current market trend. Remember, any divergence between the ADL line and the price chart could hint at potential trend reversals or changes in market sentiment.
- Focus on ADL indicator trends
- Analyze market breadth and sentiment
- Consider the slope of the ADL line
- Confirm price movements with ADL trends
Identifying ADL Indicator Divergence
How can you effectively detect ADL indicator divergence and its implications in market analysis?
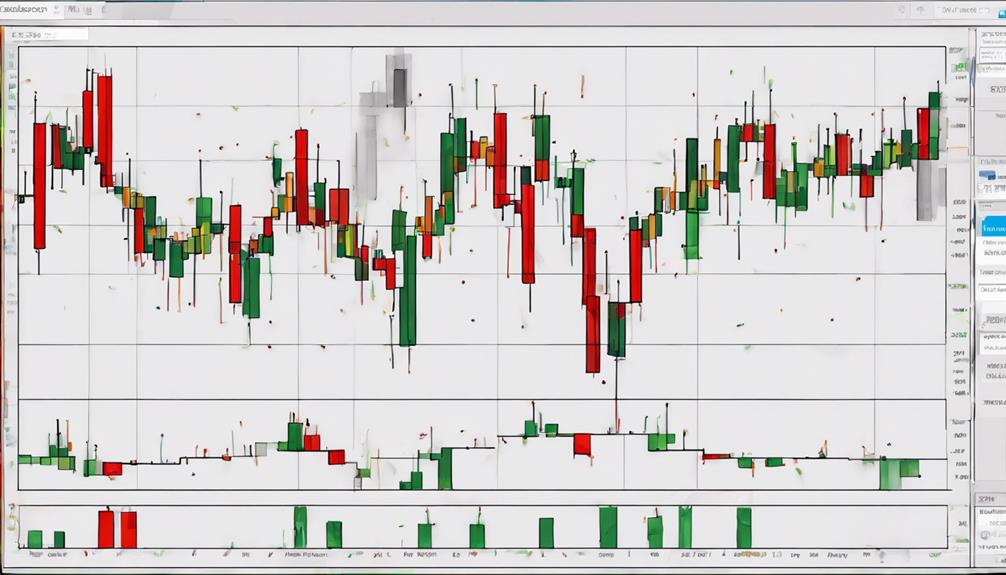
ADL indicator divergence occurs when the line moves counter to the price trend, signaling potential price reversals.
Bullish divergence, where the ADL rises while prices fall, suggests accumulation during downward movements.
Conversely, bearish divergence, when the ADL falls as prices rise, indicates distribution despite upward price trends.
Detecting ADL divergence early can provide insights into shifts in market sentiment. By using this information alongside other technical indicators, traders can confirm signals and make more informed decisions.
Understanding ADL indicator flow and volume can help anticipate potential price reversals, making it a valuable tool in analyzing market dynamics.
Incorporating ADL Indicator in Trading Strategies
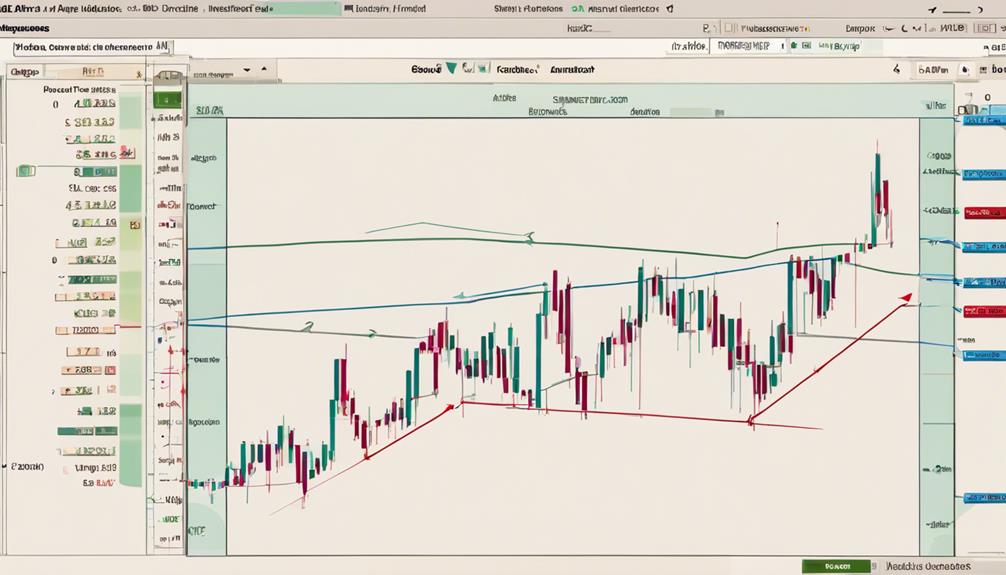
When incorporating the ADL indicator in trading strategies, consider its role in confirming market trends and detecting potential reversals by analyzing divergences from price charts. The ADL indicator can offer valuable insights into market breadth and enhance the efficiency of your trading strategies by integrating it with other technical indicators.
Keep an eye on crossovers in the ADL line as they can generate trading signals for efficient decision-making. By analyzing the relationship between the ADL line and price movements, you can gain a better understanding of market trends and potentially improve your trading outcomes.
Utilize the ADL indicator to confirm market trends.
Look for divergences to detect potential trend reversals.
Pay attention to crossovers in the ADL line for trading signals.
Integrate the ADL indicator with other technical indicators for efficient trading strategies.
How Can I Apply the ADL Technical Indicator in Practical Trading?
The ADL technical indicator measures cumulative money flow volume to predict price trends. To apply it in practical trading, look for divergences between the indicator and price movement. Traders use ADL to confirm trend strength and identify potential price reversals. Understanding the ADL technical indicator explained can improve trading strategies.
How Can I Use the ADL Indicator in Practice?
When it comes to understanding market trends, the ADL technical indicator explanation can be extremely valuable. By analyzing the accumulation/distribution line, traders can gauge the strength of a trend and make informed decisions about buying or selling. Incorporating the ADL indicator in practice can provide valuable insights for successful trading strategies.
Managing Risks With ADL Indicator

To effectively manage risks in your trading strategies, leverage the ADL indicator's ability to confirm trends and identify potential reversals in the market. By using ADL signals, you can make informed decisions to mitigate risks effectively.
The ADL indicator plays a crucial role in alerting traders to potential breakouts and confirming trend directions, aiding in risk management. Understanding ADL trend direction and divergences helps assess trend strength, allowing you to adjust risk exposure accordingly.
Combining the ADL indicator with other technical indicators enhances risk management by providing comprehensive market analysis for better decision-making. Incorporating the ADL indicator into your trading strategy can significantly improve your ability to manage risks and navigate market fluctuations efficiently.
Frequently Asked Questions
How Do You Use the ADL Indicator?
To use the ADL indicator effectively, observe market trends through its line direction and slope. Detect potential reversals when it diverges from price charts. Trade signals arise from ADL line crossovers for buying or selling opportunities.
What Is the ADL Trading Strategy?
You trade using the ADL strategy by analyzing market trends and potential reversals through the Advance-Decline Line indicator. Look for crossovers and divergences between the ADL line and price chart for effective trading signals.
How Do You Use an Accumulation Distribution Indicator?
To use an accumulation/distribution indicator effectively, observe price-volume dynamics for trend reversals. Identify divergences between price and AD line for trend confirmation and anticipate movements. Spot breakouts, bullish/bearish divergences, assess trend strength, and make informed trading decisions.
What Is the Best Indicator for Day Trading?
For day trading, the best indicator varies based on your strategy and risk tolerance. Popular choices like moving averages, RSI, MACD, and Bollinger Bands offer insights into price movements. Test different indicators to find what works for you.
Conclusion
In conclusion, mastering the ADL indicator can significantly enhance your trading performance.
Just like a skilled navigator uses the stars to guide their ship safely through the ocean, a trader who understands the ADL indicator can navigate the volatile waters of the market with confidence.
By following the practical tips outlined in this article, you can effectively utilize the ADL indicator to make informed decisions, identify trends, and manage risks in your trading endeavors.