
Imagine you're navigating a ship through turbulent waters, relying on your compass and charts to steer you in the right direction.
Similarly, in the world of trading, trend following indicators act as your guiding tools in the dynamic seas of the market. Understanding the nuances of these indicators can make all the difference between success and struggle in your trading endeavors.
So, what are the top 10 quick tips for effectively utilizing these indicators to your advantage?
Moving Averages
When analyzing market trends, utilizing moving averages can provide valuable insights into the direction of price movements. Moving averages are essential trading indicators that help traders identify trend directions effectively.
By smoothing out price data over a specific period, moving averages offer a clear representation of the market trend, making them ideal for trend-following strategies. The golden cross strategy, which involves the intersection of two moving averages, is a popular method for signaling potential buy or sell opportunities.
Traders often use different types of moving averages, such as exponential and volume-weighted averages, each offering unique advantages in trend analysis. Overall, moving averages remain classic and enduring tools in technical analysis, providing traders with valuable information for making informed trading decisions.
MACD

MACD, a widely used momentum indicator, plays a crucial role in analyzing market trends with its components including the MACD line, signal line, histogram, and zero line. When using MACD for trend analysis, keep these key points in mind:
- The MACD line crossing above the zero line indicates a bullish market trend.
- Traders often look at the signal line for potential reversal signals in the market.
- MACD is based on exponential moving averages, providing insight into changes in momentum.
- Understanding the relationship between the MACD line and the signal line can help traders make informed decisions based on momentum shifts.
On Balance Volume
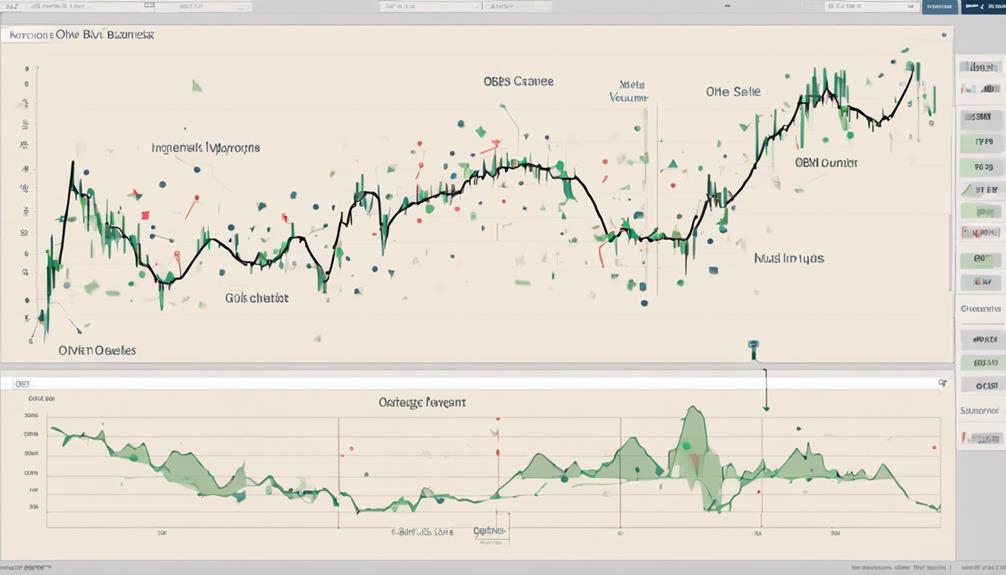
Moving on to On Balance Volume (OBV), a key momentum trading indicator that leverages volume flow to forecast price trends in securities.
OBV calculates the cumulative volume by adding the volume on up days and subtracting the volume on down days. This indicator provides valuable insight into buying and selling pressure within the market.
When OBV is rising, it confirms price trends, signaling strong buying interest and potential uptrends. Conversely, a declining OBV indicates weakening buying pressure, potentially leading to downtrends in the security's price.
Traders use OBV to validate price movements and identify possible trend reversals based on volume dynamics. Understanding OBV can enhance your ability to interpret price movements and make informed trading decisions.
Relative Strength Index
The Relative Strength Index (RSI) is a powerful indicator that evaluates the ratio of recent gains to losses to gauge potential overbought or oversold market conditions. Here are some key points to consider when using the RSI:
- RSI readings above 70 indicate overbought conditions, signaling a possible price reversal.
- Readings below 30 on the RSI suggest oversold conditions, indicating a potential buying opportunity.
- Divergence between the RSI and price movement can be a precursor to a trend reversal.
- The RSI, ranging from 0 to 100, is a widely used momentum oscillator offering valuable insights into market conditions.
Understanding these aspects of the RSI can help you make more informed trading decisions based on market conditions.
Donchian Channel
Developed by Richard Donchian, the Donchian Channel identifies market trends and signal entry points based on 20-bar highs and lows. This indicator utilizes an upper band and a lower band to track the highest and lowest price levels within a specified period.
Breakouts beyond these bands serve as potential entry signals for traders looking to capitalize on trend continuation. By focusing on price breakouts, the Donchian Channel assists traders in identifying favorable opportunities to enter or exit positions in trending markets.
To enhance the effectiveness of this indicator, traders often apply additional filters to minimize false signals, thereby refining their trend-following strategy and optimizing their trading decisions.
Parabolic SAR
Parabolic SAR is calculated using a formula that takes into account the current and previous periods' data, making it a dynamic indicator.
Traders interpret Parabolic SAR by observing the dots' position in relation to price, using it to gauge trend direction and potential reversals.
Combining Parabolic SAR with other indicators can provide a comprehensive view of market conditions and enhance trading strategies.
SAR Calculation Method
When applying the SAR Calculation Method, traders utilize a trend-following indicator known as Parabolic SAR to gauge potential reversals in price movement. Here are some key points about the SAR calculation method:
- Parabolic SAR stands for Stop and Reverse, used to identify potential reversals in price movement.
- SAR calculation involves plotting dots above or below the price chart, switching sides with trend reversals.
- The formula includes prior SAR values and acceleration factors to adapt to changing market conditions.
- Parabolic SAR dots move closer to price in trending markets and further away during consolidating or reversing periods.
Interpretation and Use
Traders benefit from the dynamic adaptability of the Parabolic SAR indicator in capturing trend changes effectively and managing risk. Parabolic SAR places dots above or below the price, providing a visual representation of the trend direction.
When the dots switch sides, it indicates a potential trend reversal, offering clear signals for traders. This indicator is commonly used in moving average trading strategies to set trailing stops, allowing traders to maximize profits during trending market conditions while mitigating risks.
Combining With Other Indicators
To enhance trend-following strategies, consider combining the Parabolic SAR indicator with other technical indicators for improved signal accuracy and confirmation in your trading decisions. When combining Parabolic SAR with other indicators like moving averages, you can benefit from a more comprehensive analysis of market trends.
Here are some reasons why combining Parabolic SAR with other indicators is beneficial:
- Utilizing moving averages alongside Parabolic SAR can help confirm trend reversals.
- Combining Parabolic SAR with RSI can provide additional insight into overbought or oversold conditions.
- The visual cues provided by Parabolic SAR dots can be complemented by the signals generated by other indicators.
- Using multiple indicators can help filter out false signals, leading to more reliable trading decisions.
Aroon
The Aroon indicator, consisting of Aroon Up and Aroon Down lines, quantifies the time elapsed since the highest high and lowest low over a specified period. Aroon Up crossing above Aroon Down signifies a robust uptrend, while Aroon Down surpassing Aroon Up indicates a strong downtrend.
With values ranging from 0 to 100, higher values reflect newer highs or lows, aiding traders in identifying potential trend shifts. This indicator is adept at capturing trending markets and can be used alongside other indicators for confirmation signals.
Traders utilize Aroon to detect potential trend reversals and evaluate the strength of ongoing trends by analyzing the relative positioning of the Aroon lines.
Bollinger Bands
Quantifying market volatility and potential price breakouts, Bollinger Bands are a technical analysis tool based on a simple moving average and two standard deviations.
When using Bollinger Bands for trend following, consider the following tips:
- Identify Overbought and Oversold Levels: Bollinger Bands help you spot potential reversal points in the market.
- Combine with Other Indicators: Enhance trend confirmation by using Bollinger Bands in conjunction with indicators like RSI or MACD.
- Trending Market Signals: Price movement within the bands suggests a trend is in place.
- Breakout Potential: Watch for strong moves when prices break outside the bands.
Summary & Application
When applying trend-following indicators, understanding the key indicators for trends, implementing them effectively, and recognizing real-world trend applications become essential.
By focusing on these points, you can enhance your ability to identify market trends accurately and make informed trading decisions.
Utilizing trend indicators in a systematic and strategic manner can significantly improve your trend-following strategies.
Key Indicators for Trends
To effectively gauge market trends, incorporating key indicators like Moving Averages, MACD, RSI, OBV, and Bollinger Bands is essential for making informed trading decisions. When analyzing trends, consider the following essential indicators:
- Moving Averages: Provide trend direction by smoothing out price data.
- MACD: Captures market momentum by comparing two moving averages.
- RSI: Identifies overbought or oversold levels for potential trend reversals.
- OBV: Confirms price trends using volume flow to assess buying or selling pressure.
Implementing Indicators Effectively
Using trend following indicators effectively requires a deep understanding of their specific functions and signals in capturing market trends. Indicators like Moving Averages, MACD, and others play vital roles in enhancing trend analysis. Moving Averages help smooth out price data to identify the trend direction, while MACD combines moving averages to signal changes in trend momentum. Proper application of these indicators aids in determining optimal entry and exit points, confirming trend directions, and evaluating trend strength accurately.
Real-World Trend Applications
Utilizing real-world trend indicators such as moving averages, MACD, RSI, and OBV enhances traders' ability to analyze market trends effectively and make informed trading decisions. These indicators help identify trend direction, momentum, overbought/oversold conditions, and volume flow to confirm price trends. By applying these indicators in real-world scenarios, traders can effectively capture trending markets, manage risk, and optimize their trading strategies.
Additionally, trend indicators like Bollinger Bands, ADX, and Parabolic SAR provide valuable insights into trend strength, volatility, and potential trend reversals for successful trading.
- Moving averages provide trend direction.
- MACD indicates momentum.
- RSI identifies overbought/oversold conditions.
- OBV confirms price trends through volume flow.
What Are Some Advanced Tips for Using Trend Following Indicators?
When utilizing essential trend following indicators, it’s essential to understand the importance of combining multiple indicators for a comprehensive analysis. Incorporating moving averages, MACD, and RSI can provide deeper insights into market trends. Additionally, incorporating trailing stops can help maximize profits and minimize losses.
Frequently Asked Questions
What Are the Best Indicators for Trend Trading?
For trend trading, the best indicators include Moving Averages like SMA and EMA, MACD for trend stability analysis, RSI to gauge price fluctuations, Bollinger Bands for volatility, and OBV to confirm trends with volume data.
What Is the Best Trend-Following Strategy?
In trend following, your best strategy involves adapting to market shifts, combining indicators for strength, and backtesting rigorously. Embrace flexibility, mix indicators wisely, and test strategies thoroughly to ride trends effectively.
What Is the Most Successful Indicator?
When considering the most successful indicator, the Moving Average Convergence Divergence (MACD) stands out for its ability to capture market momentum and provide clear signals. Traders often rely on MACD crossovers and divergences for trend identification.
What Is the Trend-Following Option Strategy?
To understand the trend-following option strategy, you focus on using indicators to identify market trends. By riding momentum in line with trends, traders aim to maximize profits and minimize losses. Key indicators include moving averages, MACD, RSI, and Bollinger Bands.
Conclusion
In conclusion, mastering the top 10 trend following indicators can significantly improve your trading strategies.
By understanding moving averages, MACD, OBV, RSI, ADX, Bollinger Bands, Aroon, Moving Average Envelopes, Parabolic SAR, and Donchian Channel, you can make informed decisions based on market trends.
So, don't be a square – stay ahead of the game and maximize your potential profits with these powerful tools at your disposal.