
To master the market with the Bollinger Band RSI strategy, one must grasp the intricate relationship between volatility and momentum indicators. Understanding Bollinger Bands and RSI is fundamental, allowing traders to gauge trends and identify entry points accurately. Customizing Bollinger Bands settings, such as altering lookback periods and standard deviations, tailors the strategy to specific market conditions. Implementing robust risk management alongside entry signals is essential for success. Combining Bollinger Bands and RSI enhances decision-making by pinpointing best trade positions. Delving deeper into strategies and practical applications unveils the full potential of this detailed guide.
Understanding Bollinger Bands and RSI
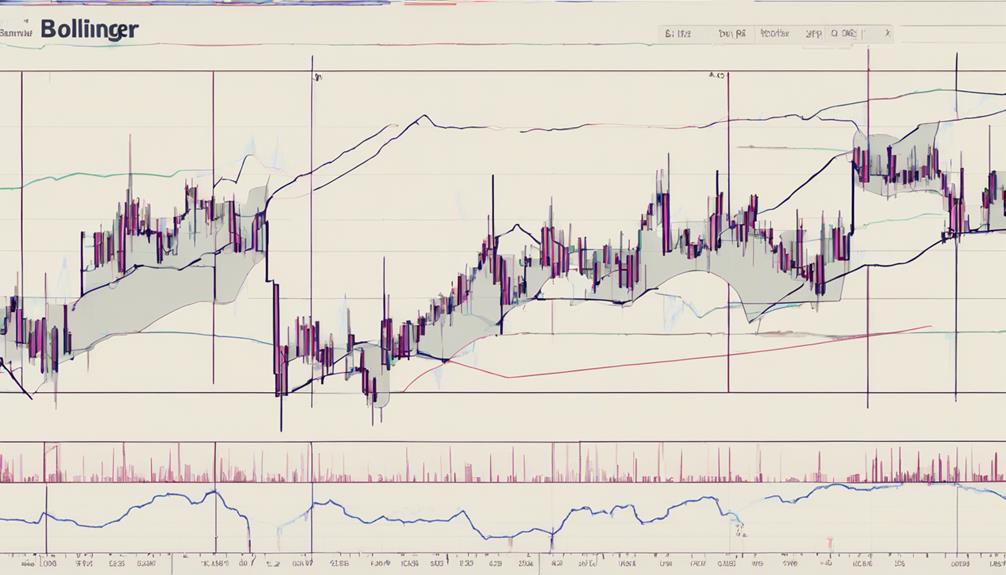
Analyzing market dynamics involves a profound understanding of Bollinger Bands, which assess volatility and trend direction, alongside the Relative Strength Index (RSI), a tool for measuring momentum and identifying overbought or oversold conditions.
Bollinger Bands, consisting of three lines – Middle, Upper, and Lower – use price movement and standard deviations to create bands that encapsulate the majority of price action. The RSI, with values ranging from 0 to 100, helps traders gauge the strength of price movements.
When integrated, RSI and Bollinger Bands offer a potent combination, enhancing trading signals and confirming potential reversals or breakouts. This synergy allows for a thorough analysis of market conditions, aiding traders in making well-informed decisions.
Key Components of Bollinger Bands
Bollinger Bands encompass key components such as the Band Width Calculation, a metric used to gauge market volatility.
The Upper and Lower Bands dynamically adjust to market conditions, offering insights into potential support and resistance levels.
Understanding these components is essential for traders looking to utilize Bollinger Bands effectively in their analysis.
Band Width Calculation
The calculation of band width within the framework of Bollinger Bands plays a pivotal role in evaluating market volatility levels and potential trading scenarios. Band width is derived by subtracting the lower Bollinger Band value from the upper Bollinger Band value. It serves as a measure of the width of the Bollinger Bands, reflecting the level of market volatility. A wider band width suggests higher volatility, indicating potential trading opportunities, while a narrower band width signifies lower volatility. Traders utilize band width to assess market conditions and anticipate price movements. Monitoring changes in band width can provide valuable insights for making informed trading decisions.
| Bollinger Bands Components | Band Width |
|---|---|
| Upper Band Value | Lower Band Value |
| Represents volatility levels | Indicates market volatility |
Volatility Measurement Tool
Utilizing Bollinger Bands as a tool for measuring volatility in financial markets provides traders with valuable insights into potential trading opportunities. These bands, consisting of a middle band (SMA) and upper/lower bands based on standard deviations, help assess price volatility.
During high volatility periods, the bands expand, indicating increased market volatility, while they contract in low volatility periods. The width between the bands serves as a gauge for market volatility levels, aiding traders in making informed decisions.
Additionally, Bollinger Bands are instrumental in identifying overbought and oversold conditions when prices touch the bands. By leveraging this volatility measurement tool, traders can better understand trend direction and anticipate potential price reversals based on interactions with the bands.
Upper and Lower Bands
How do the Upper and Lower Bands, key components of Bollinger Bands, contribute to interpreting market dynamics and potential trading signals?
The Upper Band, calculated as the Middle Band plus two standard deviations, and the Lower Band, derived by subtracting two standard deviations from the Middle Band, dynamically adjust based on market volatility levels. These bands serve as dynamic support and resistance levels for price movements.
The width between the Upper and Lower Bands reflects the current market volatility, with wider gaps indicating higher volatility and vice versa. Traders often use the interaction between price movements and these bands to gauge potential breakouts, reversals, or trend continuations, aiding in making informed trading decisions based on market conditions.
Customizing Bollinger Bands Settings
Customization of Bollinger Bands settings plays an essential role in adapting technical analysis tools to suit specific market conditions and trading strategies. Traders have the flexibility to adjust the lookback period, which affects the sensitivity of the simple moving average (SMA) within the bands.
By altering the standard deviations, traders can widen or narrow the bands, providing insights into market volatility levels. Additionally, experimenting with different types of moving averages, such as Exponential Moving Average (EMA) or Weighted Moving Average (WMA), offers varying degrees of responsiveness to price changes.
This ability to customize Bollinger Bands settings enables traders to tailor the indicator to different market conditions and trading strategies, ultimately enhancing the effectiveness of their technical analysis approach. Adapting Bollinger Bands settings based on individual preferences and trading styles allows for a more personalized and optimized use of this powerful tool in the financial markets.
Implementing Bollinger Bands RSI Strategy
Implementing the Bollinger Bands RSI Strategy involves understanding the importance of entry signals and employing effective risk management strategies.
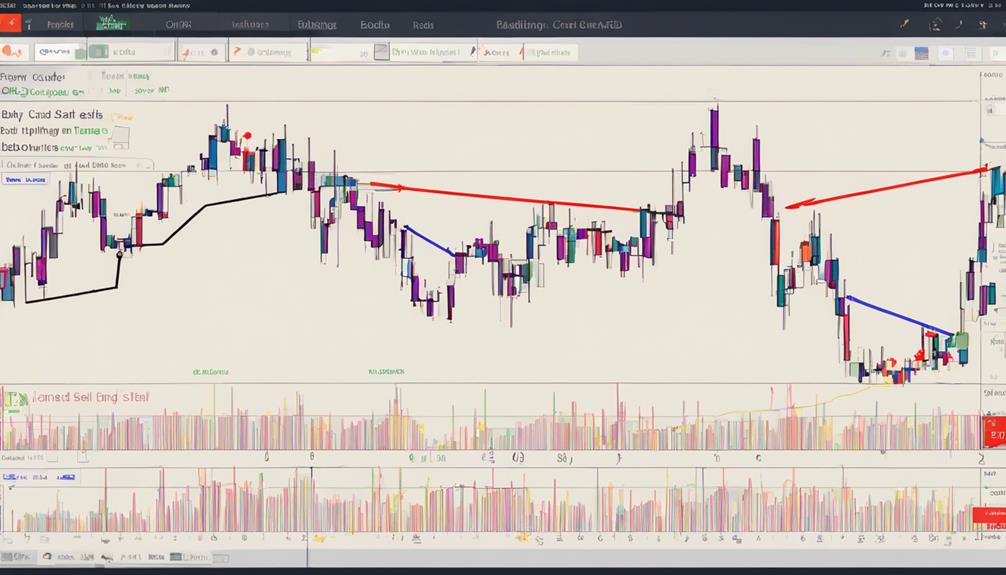
Entry signals play a vital role in identifying prime trade positions based on RSI breaches of Bollinger Bands and band width indicators.
Additionally, implementing robust risk management techniques guarantees that traders can safeguard their capital and maximize potential returns in the dynamic market environment.
Entry Signals Importance
Effectively timing trades in the Bollinger Bands RSI strategy hinges greatly on the strategic importance of entry signals. Entry signals play a critical role in determining opportune moments to enter trades by analyzing the combined insights from the RSI and Bollinger Bands indicators.
By leveraging these signals, traders can enhance the precision of their trading decisions while minimizing the occurrence of false signals. The synergy between RSI and Bollinger Bands provides a thorough view of potential trade setups, allowing traders to confirm entry points with greater confidence.
Mastering the interpretation of entry signals enables traders to capitalize on market movements efficiently, optimizing their trading strategy for improved performance and profitability in the financial markets.
Risk Management Strategies
Utilizing strategic risk management techniques based on Bollinger Bands and RSI analysis is crucial for optimizing trading decisions within the Bollinger Bands RSI strategy. Implementing stop-loss orders aligned with Bollinger Bands and RSI readings enhances risk management by safeguarding capital and minimizing losses.
Adjusting position sizes in accordance with signals from Bollinger Bands and RSI not only aids in managing risk but also guarantees trades are within the trader's risk tolerance levels. Setting stop-loss orders below the lower band for long positions and above the upper band for short positions is a fundamental risk management strategy when utilizing Bollinger Bands RSI strategy.
Adapting stop-loss levels to current market conditions and volatility further strengthens risk management practices, safeguarding against unexpected price movements and market fluctuations.
Strategies for Bollinger Bands RSI
Employing a strategic approach that combines Bollinger Bands and RSI can significantly enhance trading decisions by pinpointing best entry and exit points based on market conditions. By integrating these two powerful indicators, traders can effectively identify overbought or oversold levels in the market.
When the RSI breaches the Bollinger Bands, it can serve as a confirmation of potential trend reversals, offering valuable insights for traders. Additionally, incorporating the Bollinger Bands width into the analysis can help gauge market volatility levels when utilizing RSI, adding another layer of information for decision-making.
This thorough analysis approach enables traders to enhance the accuracy of their trading signals, providing a more informed basis for their actions in the market. By understanding how to effectively combine Bollinger Bands and RSI strategies, traders can optimize their trading approach and increase their chances of success in the market.
Practical Applications and Examples
The implementation of the Bollinger Band RSI strategy in real-world trading scenarios can offer valuable insights into market dynamics and aid in making informed trading decisions. One practical application of this strategy is to monitor RSI breaches of the Bollinger Bands, which can indicate potential trend reversals and trading opportunities. By looking for instances where the RSI moves outside the Bollinger Bands, traders can identify potential shifts in market sentiment. Additionally, utilizing touches of the upper and lower Bollinger Bands in conjunction with RSI can help confirm entry and exit points, providing a more all-encompassing trading approach. Below is a table illustrating examples of how RSI breaches of Bollinger Bands can signal potential trading opportunities:
| RSI Breach | Interpretation |
|---|---|
| Above upper band | Overbought condition, potential sell signal |
| Below lower band | Oversold condition, potential buy signal |
| Moving back within bands | Reversal signal, potential change in trend |
| Multiple breaches | Increasing momentum, potential trend continuation |
| Lack of breaches | Consolidation phase, potential market indecision |
Combining Bollinger Bands With RSI
Integration of the Relative Strength Index (RSI) with Bollinger Bands enhances the depth of market analysis by combining momentum and volatility indicators. RSI, a momentum oscillator, works synergistically with Bollinger Bands to gauge the speed and magnitude of price changes.
While Bollinger Bands track price volatility, RSI helps pinpoint potential overbought or oversold conditions for strategic entry and exit points. By melding these two indicators, traders can access a more inclusive view of market dynamics, improving the quality of their trading decisions.
Monitoring instances where RSI breaches Bollinger Bands, while considering volatility levels, can enhance the accuracy of trade signals. This amalgamation of RSI and Bollinger Bands forms a thorough analytical framework, empowering traders to make well-informed choices based on a fusion of momentum and volatility insights.
Pitfalls and Challenges to Avoid
When utilizing Bollinger Bands and RSI, traders must exercise vigilance to avoid potential pitfalls and challenges that could hinder their trading success. One common pitfall to watch out for is false signals that can be generated by Bollinger Bands and RSI, especially in choppy or range-bound market conditions. Traders should be cautious and not solely rely on these indicators without considering the broader market context and other confirming signals.
Additionally, overtrading based on signals from Bollinger Bands and RSI can be detrimental, leading to unnecessary losses. It is essential to have a disciplined approach and not execute trades excessively based on these indicators alone.
Moreover, traders should be mindful of the limitations of Bollinger Bands and RSI, particularly in fast-moving or highly volatile markets where signals may be less reliable. Understanding these limitations and using additional tools for confirmation can help mitigate potential risks. By avoiding these pitfalls, traders can enhance their decision-making process and improve their overall trading performance.
How Does the Bollinger Band RSI Strategy Compare to Using RSI for Bullish Market Trading?
When it comes to bullish market trading, using the Bollinger Band RSI strategy offers essential bullish market tips by adding a layer of volatility and momentum analysis to the traditional RSI approach. This can provide a more comprehensive view of market conditions, potentially leading to more informed trading decisions.
Real-world Application Insights
Utilizing advanced pattern recognition techniques alongside Bollinger Bands signals greatly enhances the precision and effectiveness of trade decisions in real-world trading applications. Identifying patterns such as squeezes, double tops, and double bottoms can markedly improve trading accuracy when used in conjunction with Bollinger Bands signals. Combining pattern recognition with other technical indicators, such as the Relative Strength Index (RSI) to confirm trade signals, further strengthens trading strategies. In real-world scenarios, effectively trading Bollinger Bands Squeeze situations requires skillful execution and the ability to adapt to changing market conditions.
Moreover, managing risk through strategic stop-loss orders and adjusting position sizes based on market volatility are vital aspects of successful trading with Bollinger Bands. By incorporating strategic stop-loss orders, traders can limit potential losses and protect their capital in dynamic market environments. Adhering to a disciplined approach that integrates pattern recognition, technical indicators like the RSI, and prudent risk management techniques can lead to more consistent and profitable trading outcomes.
Are the Tips for Navigating Bollinger Bands in Forex Trading Similar to the Bollinger Band RSI Strategy?
Yes, the best tips for forex trading when navigating Bollinger Bands are similar to using the Bollinger Band RSI strategy. Both involve analyzing market volatility, identifying overbought/oversold conditions, and confirming trends. Utilizing these strategies can help traders make informed decisions and maximize their profits in the forex market.
Frequently Asked Questions
How Do You Use Bollinger Bands and RSI Together?
When combining Bollinger Bands and RSI, traders can identify trends, confirm volatility, and time entries effectively.
Bollinger Bands help gauge price volatility and trend direction, while RSI indicates overbought or oversold conditions.
By observing RSI breaches of Bollinger Bands, traders can spot potential price movements.
Examining Bollinger Bands width alongside RSI readings allows for a thorough analysis of market conditions, aiding in making informed trading decisions based on trend identification, volatility confirmation, and entry timing.
Which Is Better, RSI or Bollinger Bands?
When evaluating RSI and Bollinger Bands, it is crucial to contemplate their distinct functions. RSI gauges overbought and oversold conditions, offering insight into potential reversals. Conversely, Bollinger Bands capture price volatility and trend strength.
The selection between the two depends on the trading strategy employed. RSI may be favored for mean reversion strategies, while Bollinger Bands are more suitable for trend-following approaches.
Both indicators offer valuable insights when used judiciously.
What Is the Best Strategy for Bollinger Bands Trading?
The optimal strategy for Bollinger Bands trading involves a thorough approach that integrates technical analysis, market trend identification, and effective risk management.
What Is a Powerful Strategy for Rsi?
A powerful strategy for RSI involves identifying RSI divergence, where the indicator's direction contradicts price movement, signaling potential reversals.
Additionally, monitoring RSI levels above 70 indicates overbought conditions, suggesting a potential downturn, while readings below 30 signal oversold conditions, hinting at a potential price increase.
Conclusion
To sum up, mastering the market with the Bollinger Bands RSI strategy requires a deep understanding of the technical indicators and their application.
By customizing settings and combining Bollinger Bands with RSI, traders can gain valuable insights into market trends and potential trading opportunities.
However, pitfalls and challenges must be carefully navigated to avoid costly mistakes.
Remember, in the world of trading, success often lies in the ability to navigate the complexities of the market with precision and strategy.