
You've grasped the basics of RSI and Bollinger Bands, but have you truly unlocked their combined potential? Dive deeper into practical strategies, fine-tuning techniques, and real-world applications that can elevate your trading game to new heights.
By understanding how to effectively merge these two powerful indicators, you'll be equipped to make informed decisions in volatile markets and navigate the complexities of technical analysis with confidence.
Stay tuned to uncover the secrets that could revolutionize your trading approach.
Understanding Relative Strength Index (RSI)
Understanding the Relative Strength Index (RSI) is crucial for traders seeking to gauge the momentum of price movements efficiently. Developed by J. Welles Wilder in 1978, RSI is a versatile momentum oscillator that measures the speed and change of price movements.
RSI values, ranging from 0 to 100, offer insights into market conditions, with readings above 70 signaling overbought conditions and those below 30 indicating oversold conditions. Traders utilize RSI to identify potential market reversals and corrections, enabling them to make informed decisions on entry and exit points based on market extremes.
Key Components of RSI Indicator
To grasp the significance of the Relative Strength Index (RSI) fully, it's essential to delve into the key components that form this crucial indicator. Here are the key components of the RSI indicator:
- Momentum Oscillator: RSI, developed by J. Welles Wilder, serves as a momentum oscillator.
- Overbought and Oversold Conditions: RSI values range from 0 to 100, with levels above 70 indicating overbought conditions and below 30 indicating oversold conditions.
- Price Movements: Traders utilize RSI to measure the speed and change of price movements in the market.
- Market Reversals and Corrections: RSI helps traders identify potential market reversals and corrections based on the current price momentum.
Customizing RSI Settings for Precision
Customizing RSI settings for precision involves adjusting key parameters to tailor the indicator's sensitivity effectively. By refining the RSI lookback period, traders can control the indicator's responsiveness to price changes.
Modifying the overbought and oversold levels, possibly beyond the standard 70 and 30, can align the RSI with diverse trading approaches. Experimenting with different smoothing methods, such as Wilder's smoothing, offers ways to enhance the accuracy of RSI signals.
This customization process allows for the optimization of trading decisions based on specific market conditions. Fine-tuning RSI settings is crucial for maximizing the effectiveness of this indicator in conjunction with Bollinger Bands for a comprehensive trading strategy.
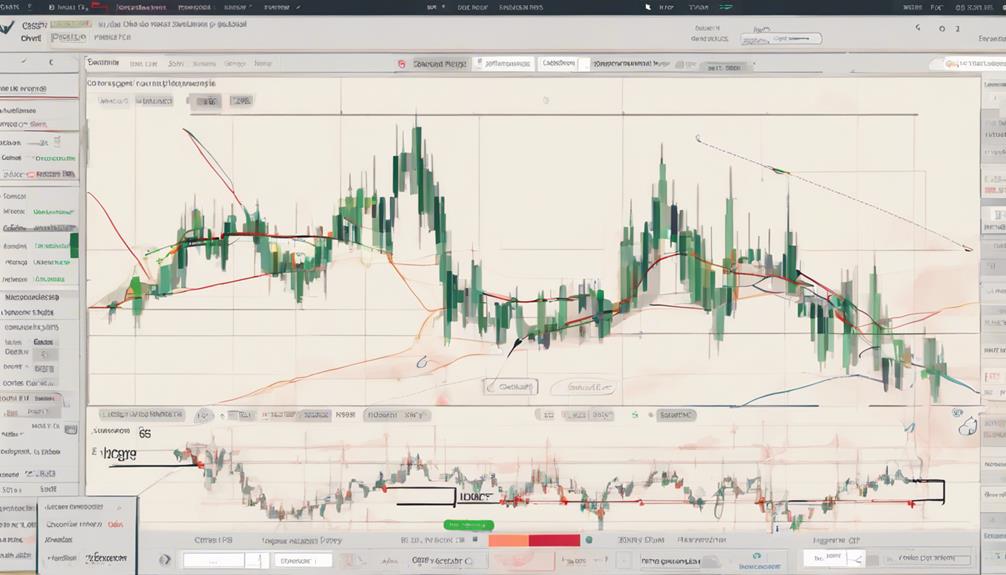
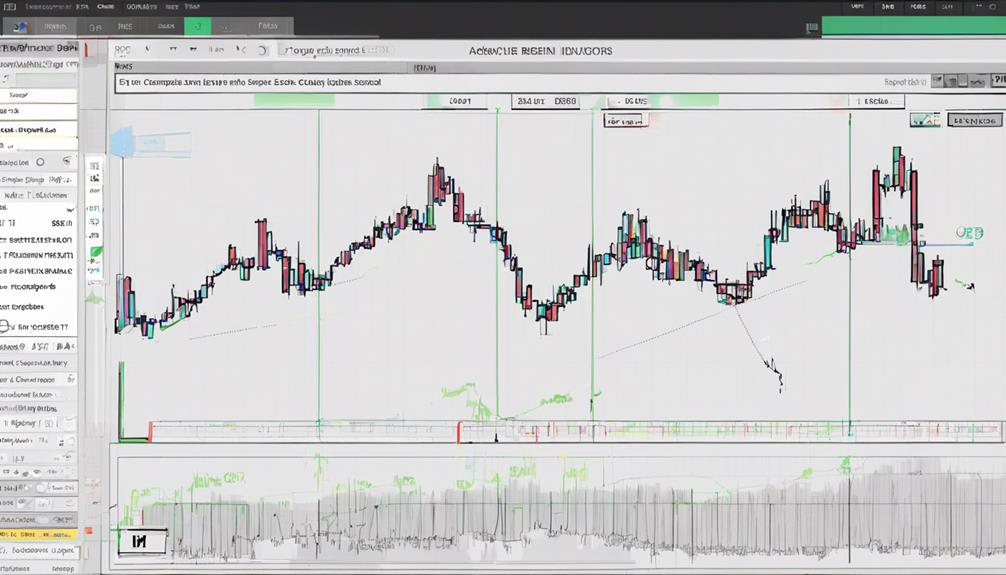
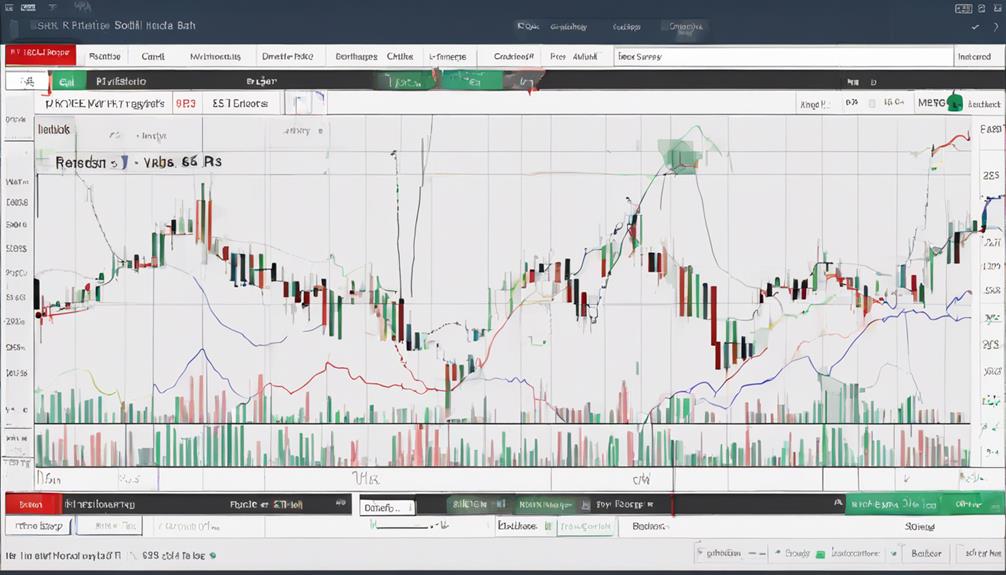
Implementing RSI and Bollinger Bands Together
To effectively integrate RSI and Bollinger Bands for trading success, consider how their combined analysis can enhance your decision-making process in volatile market conditions. When implementing RSI and Bollinger Bands together, keep the following key points in mind:
- Utilize RSI to identify overbought and oversold market conditions.
- Watch for breaches of Bollinger Bands by RSI to confirm potential reversals.
- Consider the width of Bollinger Bands as an indicator of market volatility levels.
- Integrating RSI with Bollinger Bands can enhance signal accuracy, providing a comprehensive view of market conditions to make more informed trading decisions.
Can the Bollinger Bands RSI Strategy be Utilized in Conjunction with Other Trading Strategies?
Yes, the master market bollinger band rsi strategy can definitely be used in combination with other trading strategies. By incorporating this strategy with other proven methods, traders can potentially enhance their overall trading approach and improve their chances of making successful trades in the market.
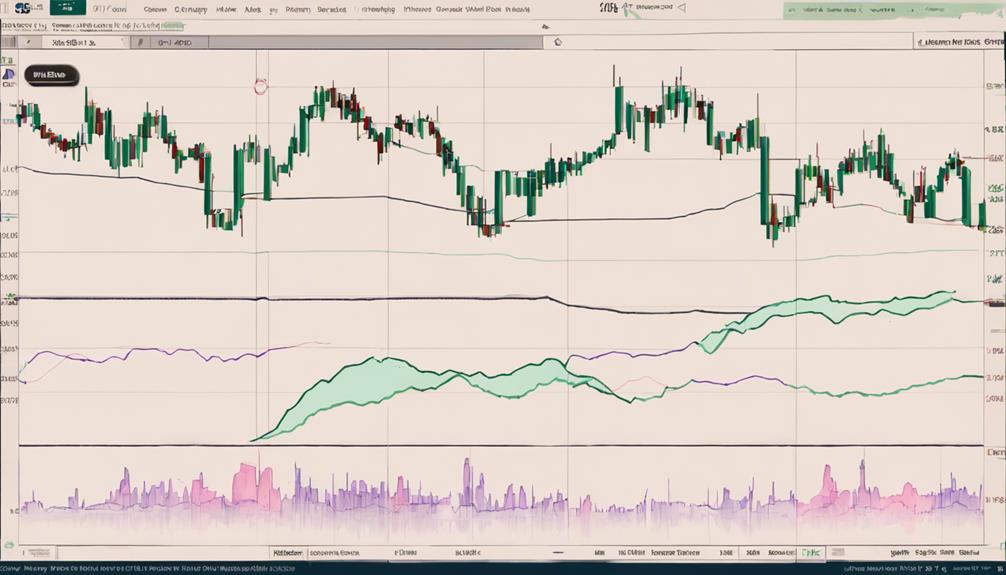
Strategies for RSI and Bollinger Bands
How can you effectively combine RSI and Bollinger Bands to develop successful trading strategies that capitalize on market conditions?
Utilizing the RSI in conjunction with Bollinger Bands can offer insightful signals for traders. When the price touches the upper Bollinger Band and the RSI indicates overbought conditions, it might signal a potential reversal.
Conversely, when the price hits the lower band alongside the RSI showing oversold levels, it could indicate a buying opportunity. Combining these indicators can help traders identify potential trend reversals, breakouts, and trade with the market's volatility.
Additionally, incorporating Bollinger Band strategies like Squeeze, Breakouts, or Walks can further enhance your trading decisions by providing a comprehensive view of market conditions.
Frequently Asked Questions
How Do You Use Bollinger Bands and RSI Together?
To use Bollinger Bands and RSI together, watch for RSI crossing 70 with Bollinger Bands touching the upper band for potential sells. Conversely, RSI under 30 with Bollinger Bands touching the lower band may indicate buys. Combining these indicators boosts trading accuracy.
Which Is Better RSI or Bollinger Bands?
When deciding between RSI and Bollinger Bands, consider your trading goals. RSI can signal entry/exit points based on momentum, while Bollinger Bands track price volatility. The choice depends on your strategy and emphasis – momentum or volatility.
What Is a Powerful Strategy for Rsi?
To develop a powerful RSI strategy, focus on combining RSI signals with price action for confirmation. Look for divergence between RSI and price movement, use RSI overbought/oversold levels cautiously, and incorporate other indicators for comprehensive analysis.
What Is the Best Bollinger Band Strategy?
In trading, the best Bollinger Band strategy involves combining RSI and Bollinger Bands to pinpoint market extremes, providing a roadmap for potential trading opportunities. This fusion of indicators creates a powerful tool for informed decision-making.
Conclusion
You've learned how to combine RSI and Bollinger Bands for effective trading strategies.
Did you know that research shows that using both indicators together can increase the accuracy of trading signals by up to 80%?
By mastering these tools and implementing them in your trading routine, you can improve your decision-making process and enhance your overall trading performance.
Keep practicing and refining your skills to become a successful technical analyst in the market.