
You're embarking on a journey through the intricate world of trading strategies with the Stochastic Oscillator as your compass.
Like a navigator charting a course through unpredictable waters, mastering the 7 key steps in harnessing this tool can lead you to potential market insights and profitable opportunities.
With each step revealing a new layer of understanding and application, you'll soon realize the power this indicator holds in guiding your trend-following decisions.
Gear up for a voyage where precision meets strategy, and where the next step could unlock a wealth of knowledge awaiting your exploration.
Stochastic Oscillator Explained
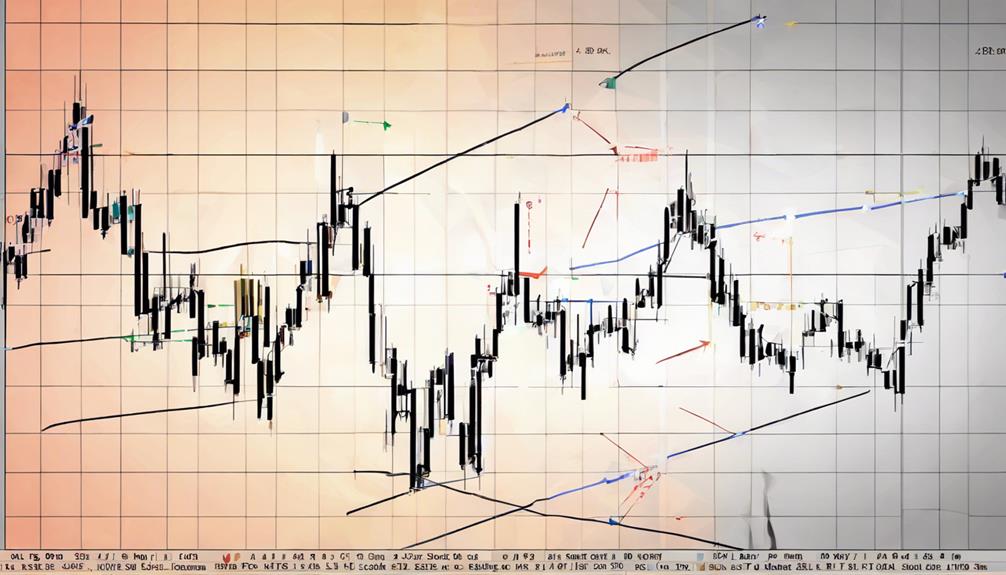
The Stochastic Oscillator, a key technical analysis tool in finance, compares a security's closing price to a range over a specified time period to assess momentum. This indicator, developed by George Lane, helps identify overbought and oversold conditions by measuring where the current closing price is relative to its price range.
Readings above 80 suggest overbought conditions, while those below 20 indicate oversold conditions. The Stochastic Oscillator plays a crucial role in predicting trend reversals and potential shifts in market sentiment. By analyzing divergence between the oscillator and price action, traders can anticipate possible changes in the trend direction.
Understanding these dynamics is essential for making informed decisions in trading and investment strategies.
Understanding %K and %D
Understanding %K and %D involves calculating key values that provide insights into potential market trends and entry points for traders.
%K, derived from the stochastic oscillator indicator, reflects the current price in relation to the highest high and lowest low.
%D, a 3-period Simple Moving Average of %K, smoothens the %K line, aiding in trend analysis.
When %K crosses above %D, it signifies a bullish signal, suggesting potential buying opportunities.
Conversely, %K crossing below %D indicates a bearish signal, hinting at possible selling opportunities.
Identifying Overbought and Oversold Levels
When looking at the Stochastic Oscillator, you can recognize overbought levels above 80 and oversold levels below 20.
These levels are significant as they can signal potential shifts in market sentiment.
Understanding these extremes can guide your entry points and trading decisions.
Overbought Signals Importance
By exceeding the threshold of 80, the Stochastic Oscillator signals overbought conditions, a crucial aspect for traders in anticipating potential market reversals.
When overbought signals are triggered, traders interpret this as a sign that the asset's price may be poised for a correction or pullback. This insight allows traders to consider scaling out of long positions or even entering short positions to capitalize on potential downward movements.
Utilizing overbought levels in conjunction with the Stochastic Oscillator aids traders in making well-informed trading decisions. Understanding the significance of overbought conditions empowers traders to strategize effectively, manage risk, and adapt their positions accordingly to optimize their trading outcomes.
Oversold Signals Relevance
Pivoting from the importance of overbought signals, identifying oversold levels through the Stochastic Oscillator is essential for recognizing potential buying opportunities in the market. When the %K line falls below 20, it signifies oversold levels, indicating potential market reversals and offering chances for traders to enter positions.
To make informed trading decisions, traders often wait for the %K line to cross above the %D line from oversold levels, providing confirmation of a potential trend reversal. Monitoring oversold signals in conjunction with other market indicators enhances the effectiveness of trend-following strategies and can lead to profitable trading opportunities.
Ideal Entry Points
To enhance your market analysis and improve trade timing, mastering the identification of overbought and oversold levels is crucial when utilizing the Stochastic Oscillator. Overbought conditions, above 80, suggest potential sell opportunities, while oversold levels, below 20, indicate buying opportunities.
Entry signals arise when the %K line crosses above the %D line, signaling a possible uptrend in overbought situations. Conversely, exit signals occur when the %K line crosses below the %D line, hinting at a potential downtrend in oversold scenarios.
Employing divergence analysis with the Stochastic Oscillator can unveil bullish divergence for potential upward reversals and bearish divergence for potential downward reversals. Understanding these dynamics can help you make informed decisions on when to buy and sell within an uptrend or downtrend.
Trend Confirmation Techniques
Utilizing the Stochastic Oscillator in conjunction with other technical indicators enhances the confirmation of trends in financial markets. To effectively confirm trends, consider the following techniques:
- Identifying Overbought and Oversold Conditions: The Stochastic Oscillator can signal potential trend reversals when the market reaches extreme levels.
- Using Moving Averages: Combining moving averages with the Stochastic Oscillator helps smooth out price data, providing a clearer trend direction.
- Enhancing Confirmation with Price Action Signals: Incorporating price action signals alongside Stochastic Oscillator readings can offer additional validation of trend strength.
Divergence Trading Strategies
When trading with divergence strategies, you must focus on identifying key signals that indicate potential trend shifts.
By applying divergence analysis in your trading approach, you can exploit discrepancies between price action and the Stochastic Oscillator readings to anticipate market movements.
Effective risk management is crucial when utilizing divergence trading strategies to ensure you can capitalize on momentum shifts while safeguarding your capital.
Identifying Divergence Signals
When analyzing Stochastic Oscillator signals for identifying divergence, traders observe the price movements in relation to the indicator to anticipate potential trend reversals. Divergence signals can provide valuable insights into possible shifts in market direction. Here are three key points to consider:
- Bullish divergence occurs when price reaches lower lows while the Stochastic Oscillator forms higher lows.
- Bearish divergence is present when price achieves higher highs as the oscillator shows lower highs.
- Divergence signals indicate potential market corrections or reversals, prompting traders to implement specific trading strategies based on these indicator signals.
Applying Divergence in Trading
To effectively implement divergence trading strategies, traders analyze the relationship between price movements and the Stochastic Oscillator to anticipate potential trend reversals.
Bullish divergence, where price makes lower lows while the Stochastic Oscillator forms higher lows, suggests a possible upward reversal.
Conversely, bearish divergence, characterized by higher highs in price and lower highs in the Stochastic Oscillator, hints at a potential downward reversal.
Divergence trading aims to capture shifts in momentum, identifying entry and exit points based on the Stochastic Oscillator's signals. It's crucial to seek confirmation from other technical indicators or price action to enhance signal reliability.
Managing Risk With Divergence
In managing risk with divergence trading strategies, you must diligently assess divergence patterns in the stochastic oscillator to inform your decision-making process. Here are three key points to consider:
- Identify Divergence Types: Distinguish between bullish and bearish divergences by analyzing the relationship between price trend and oscillator trend.
- Utilize Divergence Signals: Use divergence patterns as cues for potential trend changes, helping you anticipate shifts in the market direction.
- Integrate Technical Tools: Combine stochastic oscillator signals with other technical analysis tools to validate divergence signals and enhance the effectiveness of your trading strategy.
Utilizing Multiple Timeframes
Analyzing various timeframes allows traders to gain a comprehensive understanding of trend direction and strength in the market. By utilizing primary and secondary timeframes, traders can assess market movements more effectively, distinguishing between short-term fluctuations and longer-term trends.
Consistent trends across different timeframes serve as valuable indicators for confirming trading decisions. Integrating multiple timeframes with the Stochastic Oscillator enhances decision-making accuracy in trend-following strategies.
Shorter timeframes offer insights into immediate market dynamics, while longer timeframes help identify the overall market direction. This approach enables traders to make more informed decisions by considering a broader view of the market's behavior and trends.
Trend Following With Stochastic Oscillator
Utilize the Stochastic Oscillator to confirm and enter trades in alignment with the prevailing trend direction for enhanced accuracy in trend following strategies. When trend following with the Stochastic Oscillator, consider these key points:
- Confirm Trend Direction: Use the Stochastic Oscillator to identify the current trend direction and ensure it aligns with your trading strategy.
- Utilize Crossovers: Pay attention to Stochastic Oscillator crossovers as they can signal potential trend changes, aiding in timely trade entries.
- Enhance Accuracy: By combining the Stochastic Oscillator with trend analysis, you can improve the accuracy of identifying market trends and making informed trading decisions.
How Can Trend Following Strategies Be Incorporated into Setting Up Stochastic Oscillator?
When setting up a Stochastic Oscillator, it’s important to incorporate essential stochastic oscillator tips to follow market trends effectively. By using these strategies, traders can maximize the potential for successful trades and gain a better understanding of market movements.
Frequently Asked Questions
What Are the Stochastic Settings for 5, 3, 3?
In trading, the stochastic settings for 5, 3, 3 involve a 5-day moving average for %K, a 3-day moving average for %D, and a 3-day smoothing factor. These settings are favored for quick signals in volatile markets.
What Are the Trend Lines in Stochastic Oscillators?
In stochastic oscillators, the trend lines are %K and %D lines. The %K line shows the current closing price in relation to the high-low range, while the %D line is a 3-day simple moving average of the %K line.
What Is the Best Indicator to Combine With Stochastic Oscillator?
For the best indicator to combine with the Stochastic Oscillator, consider the Relative Strength Index (RSI) for trend confirmation. Its synergy with the Stochastic Oscillator enhances trend-following strategies and aids in identifying potential reversal points.
What Is Stochastic 14 3 3?
Stochastic 14 3 3, commonly used in technical analysis, measures momentum and identifies market conditions. With parameters set at 14, 3, 3, it balances responsiveness and smoothing, aiding in capturing short-term movements and trend reversals.
Conclusion
In conclusion, mastering the Stochastic Oscillator and trend following involves understanding key concepts like %K and %D, overbought/oversold levels, trend confirmation, divergence trading, and multi-timeframe analysis.
By following these 7 key steps, traders can enhance their ability to predict market trends and reversals effectively.
So, don't be a square – dive into the world of stochastic oscillator and trend following to stay ahead of the game in the trading world.