
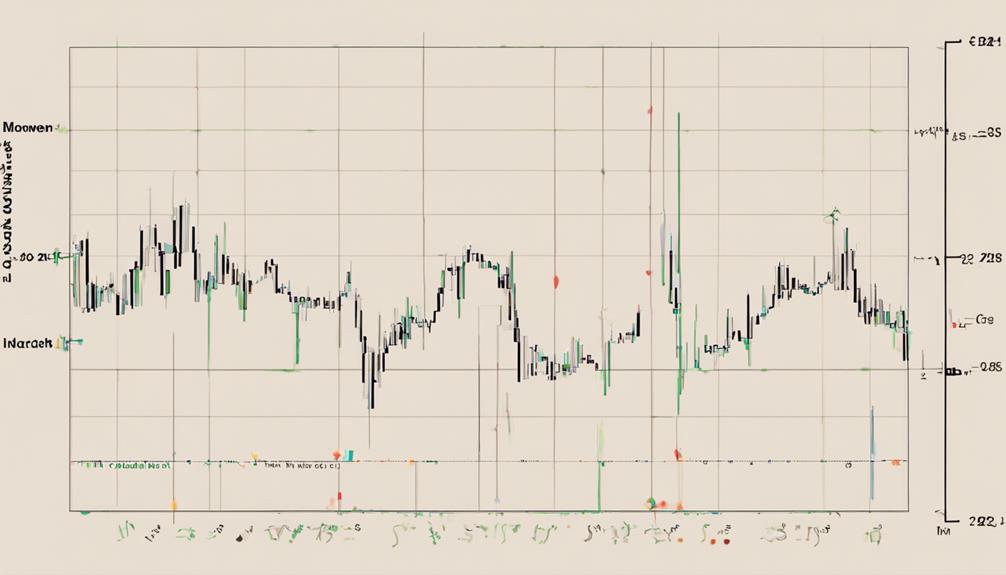
The ADX indicator stands as a cornerstone in trading strategies, providing a quantitative measure of trend strength and direction. Its significance lies in the nuanced insights it offers traders, guiding them toward optimal entry and exit points with clarity and precision.
By understanding how ADX differentiates between trending and non-trending markets, traders can capitalize on opportune moments and refine their strategies for greater effectiveness. Its integration with other indicators further amplifies its utility, making it a pivotal component for traders navigating the complexities of the financial markets.
Understanding the ADX Calculation
The computation of the Average Directional Index (ADX) in trading strategies involves intricately averaging the positive and negative directional indicators to precisely determine the strength of a trend. ADX calculation integrates smoothed moving averages and true range to quantify the momentum and strength of price movements.
By averaging the positive and negative directional indicators, the ADX formula provides a numerical value that signifies the intensity of a prevailing trend. The directional movement is essential in evaluating the price movement's strength, with higher ADX values reflecting a robust trend.
This calculation is crucial in assessing the potential sustainability of price movements in trading scenarios. The process of averaging these directional components allows traders to gauge the prevailing trend strength accurately.
Understanding the ADX calculation is fundamental for traders aiming to identify and capitalize on significant price movements in various financial markets.
Interpreting ADX Signals for Trading
Interpreting ADX signals for trading involves analyzing key numerical values that indicate the strength and potential sustainability of prevailing trends in financial markets. ADX signals above 25 suggest a strengthening trend, signaling buy opportunities.
Crossovers between the Positive Directional Indicator (+DI) and Negative Directional Indicator (-DI) lines provide crucial trading signals for determining entry and exit points. Conversely, an ADX below 25 indicates a ranging market, making it suitable for range-bound trading strategies.
Breakouts confirmed with an ADX above 25 validate momentum for sustained price moves, offering potential trading opportunities. Monitoring the ADX values is essential; rising ADX values indicate a strengthening trend, while falling ADX values signify a weakening trend.
Enhancing Strategies With ADX
Enhancing trading strategies with the ADX indicator involves leveraging its quantitative analysis of trend strength to optimize decision-making processes. The ADX indicator plays a crucial role in providing traders with a clear understanding of trend direction and momentum in the market.
By combining ADX with other indicators such as RSI and MACD, traders can enhance their trend analysis capabilities. ADX crossovers and trend confirmations facilitated by the indicator assist in identifying optimal entry and exit points for trades.
It is essential for traders to interpret ADX values ranging between 0 and 100 effectively to develop successful trend-based trading strategies. By integrating the insights provided by the ADX indicator into their trading methodologies, traders can make more informed decisions and potentially improve the overall performance of their strategies in various market conditions.
Leveraging ADX With Other Indicators
Leveraging ADX in conjunction with various indicators enhances the robustness of trend analysis and decision-making in trading strategies. When combined with other technical tools, ADX can offer comprehensive insights into market trends and potential entry and exit points.
Here are five ways to effectively utilize ADX with other indicators:
- Combining ADX with RSI helps identify overbought/oversold conditions in ranging markets.
- ADX can be effectively paired with Parabolic SAR for trend following strategies.
- The MACD indicator complements ADX for enhanced trend confirmation.
- Utilizing ADX with moving averages can provide strong signals for entry and exit points.
- ADX can be used alongside Bollinger Bands for comprehensive trend analysis.
Optimizing ADX Indicator for Trading
To maximize the effectiveness of the ADX indicator in trading strategies, it is crucial to focus on optimizing its application through a deep understanding of the relationship between the Plus Directional Indicator (+DI) and Minus Directional Indicator (-DI) lines.
The ADX indicator, a technical indicator, measures trend strength by analyzing the difference between the +DI and -DI lines. A higher variance between these two lines results in elevated ADX readings, signifying a more robust trend in the market.
Given that ADX is a lagging indicator that confirms existing trends, it is particularly valuable for trend-following strategies. Traders can optimize the ADX indicator by combining it with other technical indicators to make more informed and enhanced trading decisions.
What are the advantages of using the ADX indicator in trading strategies?
The ADX indicator is a powerful tool for trading strategy enhancement with ADX. It helps traders identify the strength of a trend, making it easier to make informed decisions. By incorporating the ADX indicator into their trading strategies, traders can benefit from improved trend analysis and more effective risk management.
Frequently Asked Questions
What Is the Importance of ADX Indicator?
The ADX indicator holds significance for traders as it quantifies trend strength and aids in identifying optimal entry and exit points. Rising ADX values signal strong trends, while falling values indicate weakening trends, assisting in strategic decision-making.
What Is the ADX Trading Strategy?
The ADX trading strategy utilizes the Average Directional Index to gauge trend strength. By analyzing crossovers between the +DI and -DI lines, traders can identify market trends. ADX values above 25 signal potential trading opportunities based on trend strength.
Is ADX Good for Scalping?
While ADX offers insights into trend strength over longer periods, it is not ideal for scalping due to its lagging nature. Scalpers often prefer quicker indicators like Stochastic Oscillator or Bollinger Bands for rapid trade decisions.
What Is the Best ADX Setting for Day Trading?
The best ADX setting for day trading is often considered to be around 14 periods, providing a balance between sensitivity and reliability. However, day traders may also experiment with shorter settings like 10 periods for more timely signals.
Conclusion
In conclusion, the ADX indicator serves as a beacon of light in the murky waters of trading, guiding traders through the trends and signals with precision and clarity.
Like a compass in a stormy sea, ADX helps navigate the complexities of the market, providing valuable insights and opportunities for successful trading strategies.
Its significance lies in its ability to illuminate the path to profitable trades amidst the chaos of the financial markets.