
When it comes to navigating Bollinger Bands in Forex trading, remember the old saying, 'The trend is your friend.' Understanding how to utilize these bands effectively can significantly impact your trading outcomes.
From setting up the right parameters to identifying trend reversals, each step plays a crucial role in your success. As you explore the ten best tips for mastering Bollinger Bands, you'll uncover valuable insights that can enhance your trading strategy and potentially boost your profitability.
Basics of Bollinger Bands
To grasp the fundamentals of Bollinger Bands, you must understand the composition and function of these technical indicators in Forex trading.
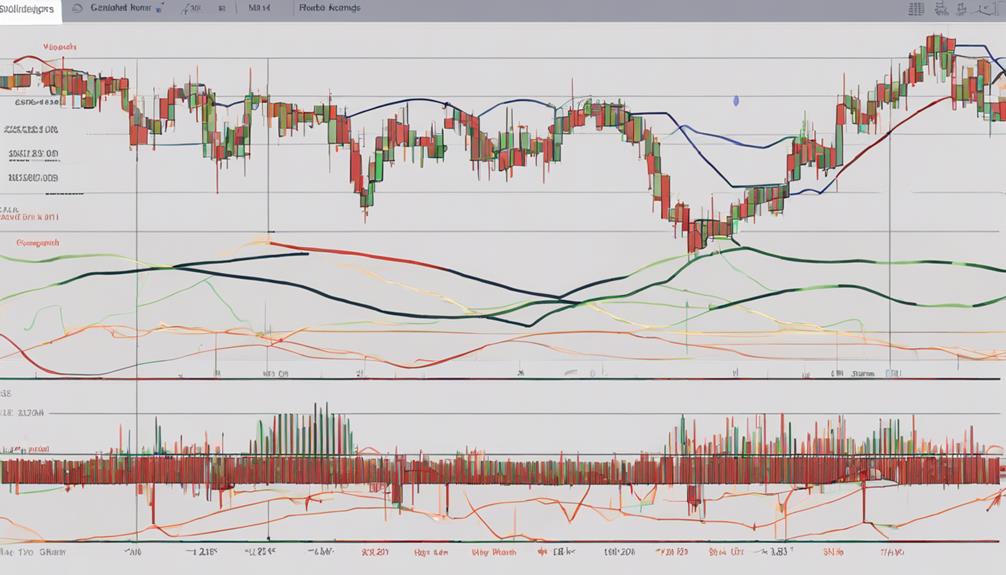
Bollinger Bands consist of three lines: a middle band (20-day SMA) and upper/lower bands set at 2 standard deviations from the middle band. These bands contract in low volatility markets and expand in high volatility markets, offering insights into potential price movements.
They also help identify overbought or oversold conditions based on price deviation from the moving average. The width of the bands reflects market volatility, with wider bands signaling higher volatility and narrower bands indicating lower volatility.
Understanding the basics of Bollinger Bands is crucial for interpreting price action and making well-informed trading decisions in the Forex market.
Understanding Volatility Signals
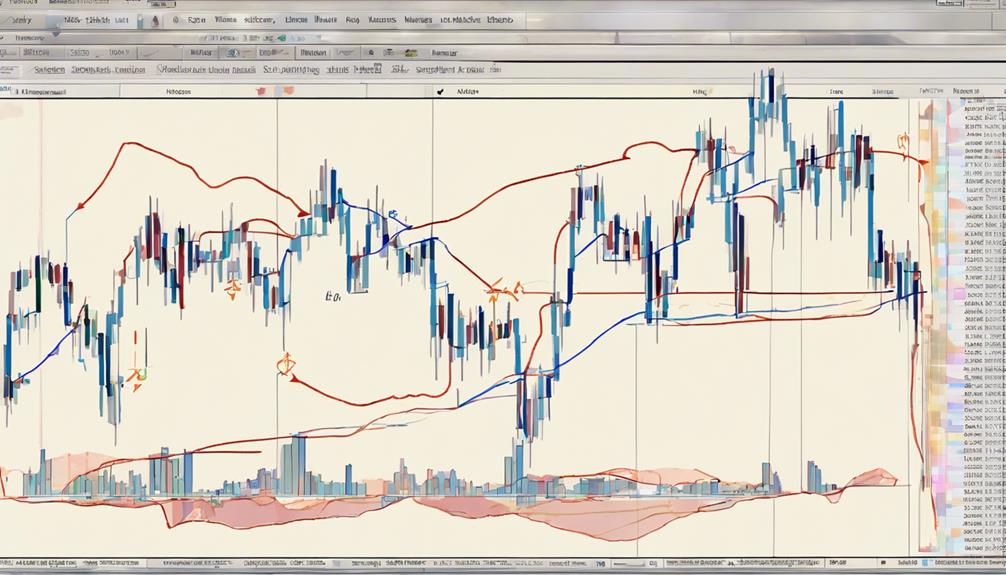
Expanding Bollinger Bands in volatile markets signify increased market activity and potential trading opportunities. When navigating volatility signals using Bollinger Bands, consider the following:
- Widening Bands: Increased volatility causes the bands to expand, indicating potential trading opportunities as prices are more likely to experience significant movements.
- The Squeeze: A convergence of the bands towards the moving average signals decreased volatility, often preceding a period of increased price action, making it a reliable indicator of potential breakouts.
- Overbought or Oversold Conditions: Understanding volatility signals can help identify when prices are overextended, providing insight into potential reversal points and aiding in decision-making regarding market entry or exit strategies.
Setting Up Proper Parameters
When establishing the appropriate parameters for Bollinger Bands in Forex trading, it's crucial to consider the significance of selecting a 20-period simple moving average as the middle band. This moving average serves as the baseline for the bands, providing a clear reference point for price movements.
Additionally, the standard deviation multiplier for the upper and lower bands is commonly set at 2 in a standard configuration. However, traders can adjust these parameters to align with their specific trading strategies and risk preferences. By experimenting with different period lengths and standard deviation multipliers, traders can fine-tune their Bollinger Bands to better capture market dynamics and optimize trading decisions.
Adhering to consistent parameter settings is key to utilizing Bollinger Bands effectively within trading strategies.
Identifying Trend Reversals
When looking to identify trend reversals using Bollinger Bands, focus on spotting:
- Reversal candlestick patterns
- Divergence in price action
- Volume confirmation signals
These indicators can offer valuable insights into potential shifts in market direction. By paying attention to these key points, you can enhance your ability to anticipate and react to trend reversals effectively.
Reversal Candlestick Patterns
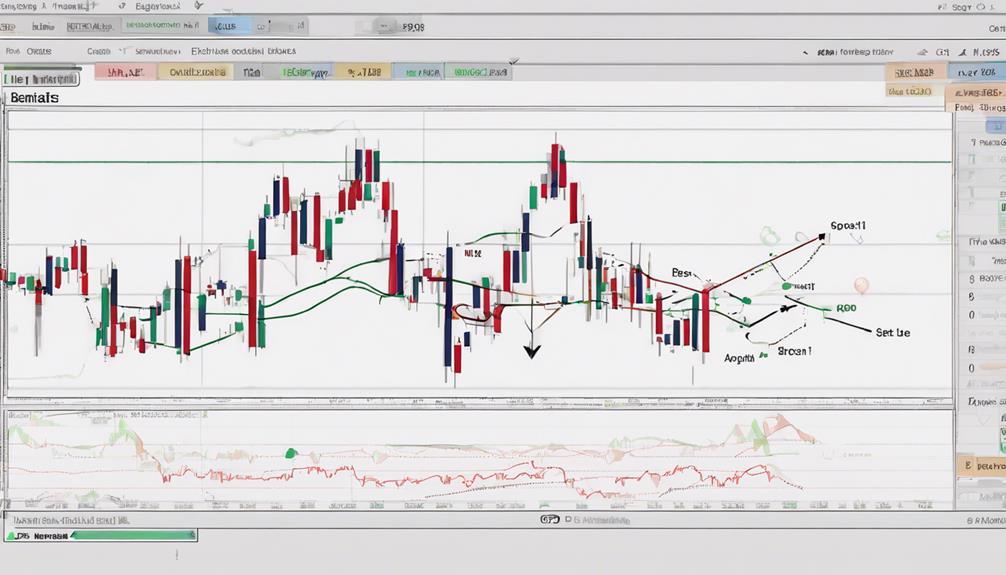
Identifying trend reversals in Forex trading can be effectively achieved by recognizing key reversal candlestick patterns near Bollinger Bands. When looking for potential trend changes, keep an eye out for patterns like the Hammer, Doji, and Shooting Star near these bands.
It's crucial to seek confirmation through volume and other indicators to boost the reliability of these patterns. Additionally, Engulfing patterns, such as Bullish/Bearish Engulfing, can serve as robust signals for trend reversals when paired with Bollinger Bands.
The presence of these reversal candlestick patterns at significant Bollinger Bands levels can present high-probability trading opportunities, enhancing trading strategies by accurately pinpointing potential trend shifts.
Divergence in Price
Divergence in price signals potential trend reversals when the price trend and the direction of Bollinger Bands don't align. Traders use this indicator to anticipate shifts in market direction.
Bullish divergence occurs when the price forms lower lows while Bollinger Bands make higher lows, suggesting a possible upward reversal. Conversely, bearish divergence happens when the price creates higher highs while Bollinger Bands show lower highs, indicating a potential downward reversal.
Identifying these divergences can assist traders in anticipating market shifts and making well-informed trading decisions. By recognizing these patterns, traders can better position themselves to take advantage of potential trend reversals in the market.
Volume Confirmation Signals
To strengthen your analysis of potential trend reversals using Bollinger Bands in forex trading, consider incorporating volume confirmation signals to validate the likelihood of a market shift. When looking for signs of a trend reversal, pay attention to the trading volume alongside Bollinger Bands.
Here's how you can use volume confirmation signals effectively:
- Increased Trading Volume: Watch for a surge in trading volume when the price moves beyond the bands, as this can signal a strong trend reversal.
- Volume Analysis Validation: Combining volume analysis with Bollinger Bands helps confirm the strength of a potential trend reversal.
- Low Volume Caution: Be cautious of trend reversals if the breakout outside the bands occurs with low trading volume, as it may indicate a false signal.
Utilizing Bollinger Bands in Entries
When looking to make entries using Bollinger Bands in forex trading, it's crucial to analyze price action near the bands for potential trade signals. Bollinger Bands can help identify entry points when the price touches or crosses the upper or lower bands, indicating possible overbought or oversold conditions.
Traders often seek confirmation from other indicators like RSI or MACD to validate signals before entering a trade based on Bollinger Bands. Understanding the relationship between price movements and the bands' levels is essential for utilizing Bollinger Bands effectively in entries.
Managing Risk With Bollinger Bands
To effectively manage risk in forex trading using Bollinger Bands, it's essential to set stop-loss levels based on market volatility and price action. Here are three key strategies to enhance your risk management with Bollinger Bands:
- Adjust Stop-Loss Based on Band Width: Modify your stop-loss levels according to the width of the Bollinger Bands to account for increased or decreased market volatility.
- Implement Strict Risk Rules: Enforce disciplined risk management practices, especially when trading near the upper or lower bands, to minimize potential losses.
- Consider Band Distance for Position Sizing: Avoid overleveraging by considering the distance between the bands when determining your position sizes, aligning them with your risk tolerance levels effectively.
Combining Bollinger Bands With Other Indicators
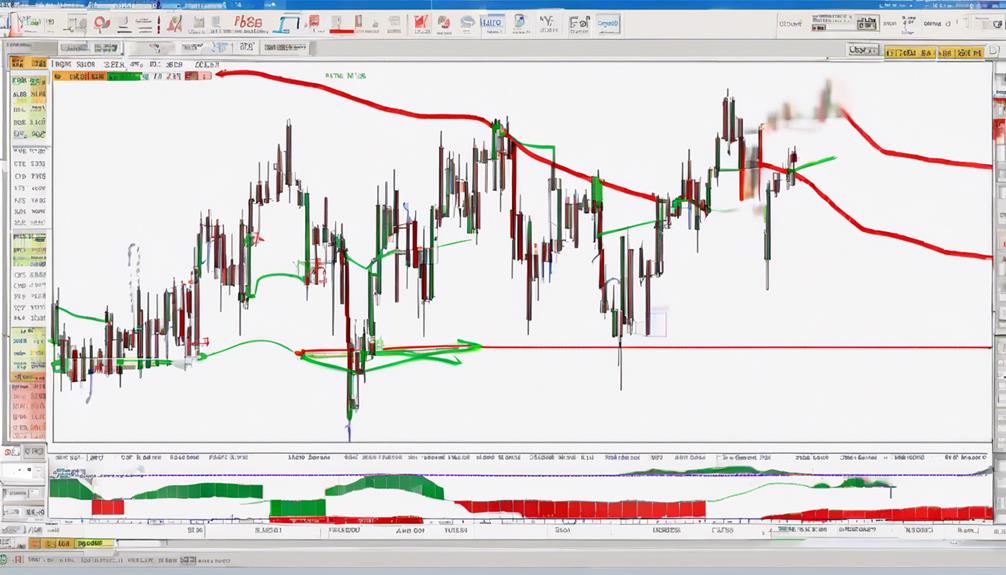
Enhance your forex trading strategies by combining Bollinger Bands with other indicators to gain deeper insights into market trends and potential entry/exit points. When paired with the Relative Strength Index (RSI), Bollinger Bands can help confirm overbought or oversold levels, providing more reliable trading signals.
Additionally, utilizing the Moving Average Convergence Divergence (MACD) indicator with Bollinger Bands offers valuable information on trend strength and potential reversal points. Integrating the Stochastic Oscillator with Bollinger Bands aids in identifying entry and exit points based on price momentum and trend direction.
This strategic combination of Bollinger Bands with the RSI, MACD, and Stochastic Oscillator can enhance your trading decisions by providing a more comprehensive analysis of market conditions.
Avoiding Common Mistakes

Avoid the trap of relying solely on Bollinger Bands for trade signals; they're most effective when used alongside other indicators.
Watch out for false signals that may occur when prices touch the bands, as these don't always signal valid trading opportunities.
Keep in mind that Bollinger Bands work best in range-bound markets and may be less reliable in strong trending conditions.
Proper Band Width
Understanding the importance of proper band width is fundamental for accurate analysis in forex trading, as it directly reflects market volatility. When it comes to Bollinger Bands, the band width plays a crucial role in determining the level of volatility in the market. Here are three key points to consider regarding band width:
- Narrow Bands: Indicate low volatility, suggesting a period of consolidation or ranging market conditions.
- Wide Bands: Signal high volatility, indicating potential significant price movements or market turbulence.
- Trading Opportunities: Proper interpretation of band width fluctuations can help identify potential trading opportunities based on volatility levels.
Timing Entry Points
When timing entry points while trading with Bollinger Bands, it's crucial to consider multiple indicators for trade confirmation and avoid relying solely on band touches to minimize the risk of false signals. Instead of entering trades based solely on upper or lower band touches, look for validation from indicators like RSI or MACD.
Analyze the price action along with Bollinger Bands signals for more accurate entry points. Ensure alignment with the prevailing trend and market conditions before executing a trade near the bands. Patience is key; wait for a clear setup that aligns with your trading criteria.
Risk Management Strategies
To effectively manage risks in forex trading with Bollinger Bands, it's essential to strategically set stop-loss orders just beyond the bands' boundaries to safeguard against potential losses.
When implementing risk management strategies, remember to avoid relying solely on Bollinger Bands signals and instead combine them with other indicators for confirmation.
Additionally, proper position sizing according to your account size and risk tolerance is crucial for capital protection.
To enhance risk management further, consider using trailing stop-loss orders to secure profits and shield against abrupt price reversals.
Regularly assessing and adjusting your risk management tactics based on market conditions and overall trading performance can help optimize your trading outcomes.
Stay vigilant and disciplined to navigate the forex market successfully.
Fine-Tuning Your Trading Strategy
Adjusting the settings of Bollinger Bands, such as the period and standard deviation, is crucial for fine-tuning your trading strategy in the forex market. By customizing these parameters, you can adapt the bands to suit different trading styles and timeframes effectively. This adjustment aids in refining your entry and exit points, ensuring they align with price actions near the bands for optimal decision-making.
Additionally, incorporating complementary indicators like RSI or MACD can further validate signals generated by Bollinger Bands, enhancing the overall strategy's accuracy. Moreover, practicing prudent risk management by setting appropriate stop-loss levels based on market volatility and individual trade setups is essential for safeguarding your capital.
Continuously monitoring and adjusting your strategy with Bollinger Bands will help you stay adaptable to changing market conditions and trends.
What Are the Main Similarities and Differences in Using Bollinger Bands for Forex and Crypto Trading?
When it comes to key insights bollinger bands crypto trading, there are both similarities and differences in using them for forex and crypto trading. Both markets can benefit from the bands’ ability to track volatility and identify potential trend reversals. However, the unique characteristics of each market may require different parameters for optimal use.
How Can the Tips for Navigating Bollinger Bands in Forex Trading Apply to Crypto Trading?
When it comes to navigating Bollinger Bands in forex trading and applying them to crypto trading, key insights into bollinger bands crypto are essential. These tips provide valuable guidance for understanding price volatility, identifying trend reversals, and determining entry and exit points. By utilizing Bollinger Bands techniques, traders can gain a better understanding of market conditions and make informed decisions in both forex and crypto trading.
Reviewing and Adjusting Approach
To optimize your Bollinger Bands strategy effectively, regularly reviewing and adjusting your approach is essential in adapting to dynamic market conditions. When fine-tuning your trading strategy, consider the following:
- Assess Currency Pair's Volatility: Tailor your Bollinger Bands strategy to the specific currency pair you're trading. Adjust parameters to match the pair's volatility levels for more accurate signals.
- Evaluate Historical Price Movements: Analyze past price action to identify patterns and trends. Use this information to refine your entry and exit points when utilizing Bollinger Bands.
- Monitor Band Width Changes: Keep an eye on the width of the bands as it can indicate shifts in volatility. Adjust your strategy accordingly to capitalize on changing market conditions.
How Can I Utilize Bollinger Bands in Forex Trading to Improve my Day Trading Skills?
To improve your day trading skills, mastering Bollinger Bands day trading use is essential. By understanding how to use Bollinger Bands in forex trading, you can identify potential entry and exit points, and make more informed trading decisions. With practice and experience, you can utilize Bollinger Bands to enhance your day trading strategies.
Frequently Asked Questions
What Is the Best Strategy With Bollinger Bands?
Identify price extremes near Bollinger Bands for potential reversal or continuation signals. Anticipate breakouts with the Bollinger Squeeze after low volatility periods. Combine with RSI or MACD for better confirmation. Manage risks wisely and adjust settings accordingly.
How Do You Trade With Bollinger Bands in Forex?
To trade with Bollinger Bands in forex, observe price action near the bands for potential entry and exit points. Gauge market volatility and trend signals. Combine with indicators like RSI or MACD for confirmation. Adjust settings for optimal results.
How Do You Master Bollinger Bands?
To master Bollinger Bands, understand their components, adjust parameters for optimal performance, interpret price action around the bands, practice with various strategies like Bollinger Bounce or Squeeze, and integrate them with other indicators for informed trading decisions.
Which Indicator Works Best With Bollinger Bands?
When trading with Bollinger Bands, the Relative Strength Index (RSI) can confirm trade setups. Combine the Moving Average Convergence Divergence (MACD) for trend identification. Stochastic Oscillator helps spot overbought/oversold conditions. Average True Range (ATR) calibrates volatility. Commodity Channel Index (CCI) confirms momentum.
Conclusion
Congratulations! You have mastered the art of navigating Bollinger Bands in Forex trading. Remember, just like a skilled sailor relies on the stars to guide their ship through choppy waters, you can use Bollinger Bands to steer your trades towards success.
By understanding volatility signals, setting proper parameters, and combining indicators effectively, you can confidently navigate the market with precision and confidence.
Keep honing your skills and fine-tuning your strategy to stay ahead of the game. Happy trading!