
Imagine moving averages as the steady rudder guiding your ship through the unpredictable waters of financial markets. But what exactly are they and how can they benefit your trading strategies?
By understanding the nuances of different moving averages like SMA and EMA, you gain insight into trend dynamics that could potentially enhance your decision-making process.
Let's explore the intricacies of these essential tools and uncover their practical applications in technical analysis.
Definition of Moving Averages
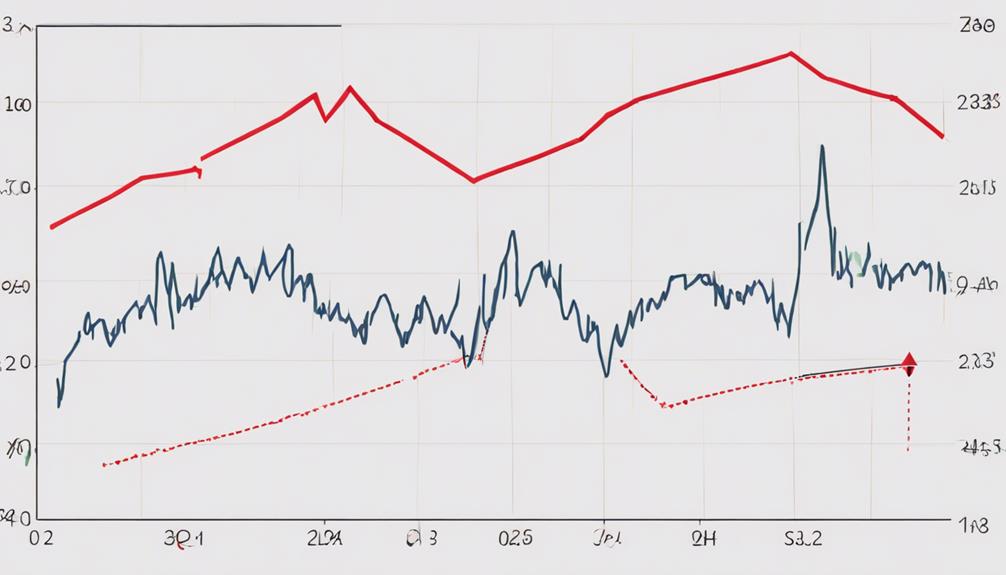
Explaining the concept of moving averages in technical analysis helps you identify trends in price data over specific periods. Moving averages, whether Simple Moving Average (SMA) or Exponential Moving Average (EMA), smooth out price fluctuations, providing a clearer picture of market direction.
By calculating the average price of an asset over time, these indicators help you determine potential support and resistance levels on charts. As prices move above or below the moving average line, it can signal shifts in market sentiment.
Utilizing moving averages in your analysis can assist you in making informed trading decisions based on historical price data, enhancing your ability to navigate the complexities of the financial markets.
Types of Moving Averages

Different types of moving averages play crucial roles in technical analysis, offering various approaches to analyzing price trends.
The Simple Moving Average (SMA) calculates the average of closing prices over a specific period with equal weightage.
In contrast, the Exponential Moving Average (EMA) gives more weight to recent prices, making it more responsive to price changes.
Weighted Moving Average (WMA) assigns different weights to prices based on their position in the time series.
Smoothed Moving Average (SMMA) and Adaptive Moving Average (AMA) are variations of moving averages that offer different smoothing techniques for price data analysis.
Understanding the distinctions between these types of moving averages can enhance your ability to interpret and predict market movements effectively.
Simple Moving Average (SMA)
Calculating the average price of a security over a specific time period, the Simple Moving Average (SMA) provides a smoothed line on a chart to help identify trends by reducing noise and fluctuations in price data.
Traders use SMAs as a technical indicator to gauge trend direction. Unlike the Exponential Moving Average (EMA), which gives more weight to recent prices, the SMA treats all prices equally within the chosen period.
This lagging indicator is valuable for spotting potential support and resistance levels. Crossovers between the SMA and price action can generate buy and sell signals. Simple to compute and widely accepted, the SMA remains a fundamental tool in technical analysis for assessing a security's overall price trend.
Exponential Moving Average (EMA)
The Exponential Moving Average (EMA) is a dynamic technical analysis tool that places more emphasis on recent price movements compared to older data points. EMA calculations involve a smoothing factor that determines the weight given to each price data point, making it more responsive to market fluctuations than the Simple Moving Average (SMA).
Traders use EMAs for short-term trend analysis, identifying entry and exit points in the market. EMA crossovers, where shorter EMAs cross above or below longer EMAs, are valuable signals for potential changes in price direction.
Due to its responsiveness and focus on recent price changes, the EMA is widely utilized by traders seeking to capitalize on short-term market movements efficiently.
How Do Moving Averages Help in Technical Analysis and Trading?
Moving averages techniques are crucial in technical analysis and trading. By applying moving averages techniques, traders can identify trends, potential support and resistance levels, and market momentum. This information helps traders make informed decisions about when to enter or exit a position, enhancing their overall trading strategy.
Practical Applications of Moving Averages
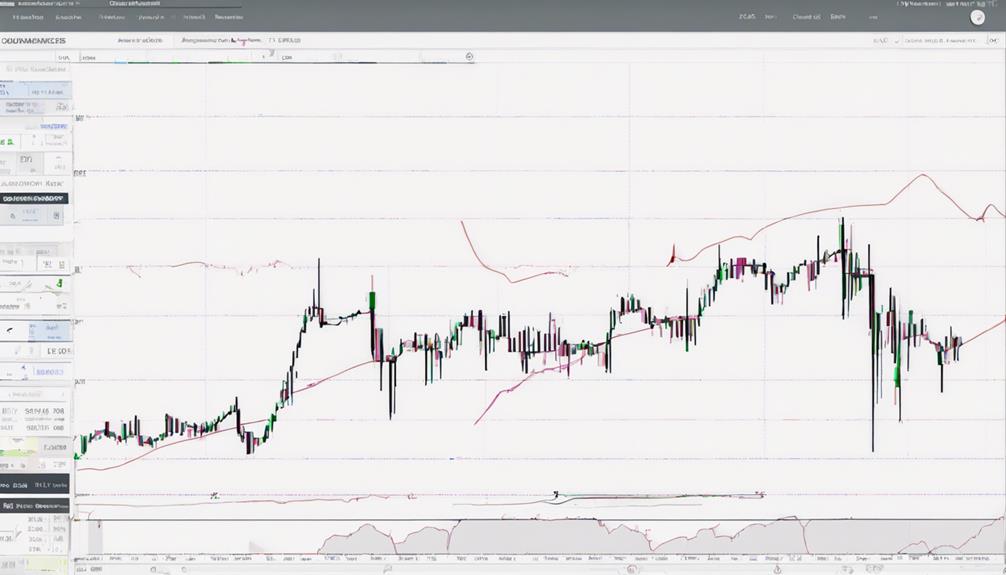
Moving averages serve as invaluable tools for traders, offering practical applications in identifying trends and potential buy or sell signals in financial markets. By using different types of moving averages like the exponential moving average (EMA), traders can analyze price action over different time frames to determine market sentiment.
These moving average lines can act as dynamic support levels, indicating potential buy signals when prices bounce off them. Additionally, traders utilize moving averages on charts to smoothen out price fluctuations and identify longer-term moving trends.
Observing crossovers between price and moving averages helps traders make informed decisions based on the interactions, supporting them in determining market direction and identifying potential entry or exit points.
How Do Moving Averages Help in Technical Analysis?
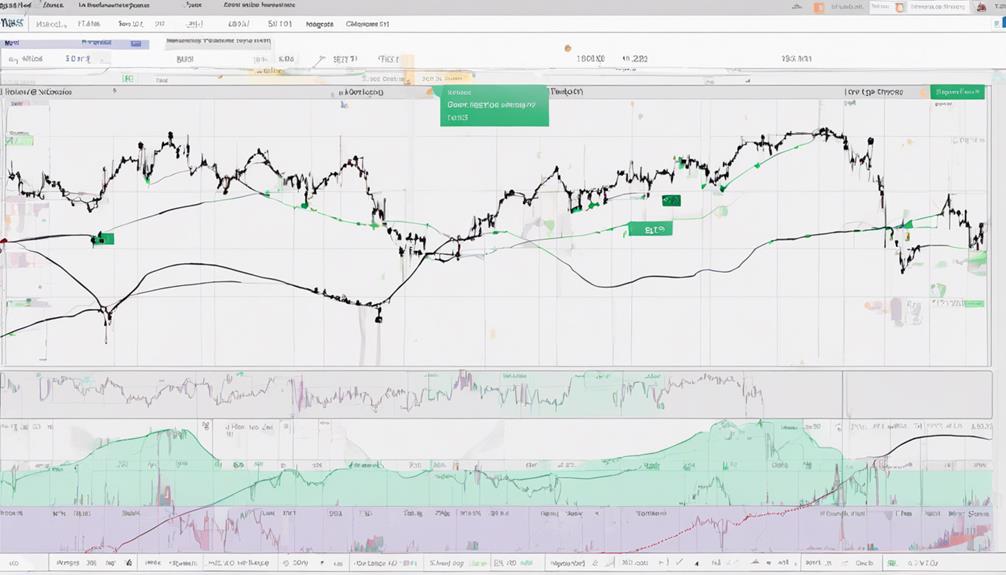
Moving averages are essential in technical analysis. They help smooth out price data to identify trends, making it easier to spot buy or sell signals. Traders use different time frames and combinations of moving averages to confirm trends. Utilizing these essential moving average tips can improve decision-making in trading.
Frequently Asked Questions
What Are the 4 Major Moving Averages?
To understand the 4 major moving averages, consider their distinct features: SMA for basic averages, EMA for recent price emphasis, WMA for varied weights, and SMMA for smoothed values. Each aids trend analysis in trading decisions.
What Does the 20 Day Moving Average Tell You?
When looking at the 20-day moving average, it tells you the average price of a security over the past 20 trading days. This indicator smooths out price fluctuations, giving you insights into short-term trends for trading decisions.
What Is an Example of a Moving Average?
An example of a moving average is a 50-day SMA for a stock that calculates the average closing price over the last 50 trading days. This indicator helps you gauge trends and potential support/resistance levels.
What Is the Best Moving Average for Analysis?
For analysis, consider your strategy and time frame. Short-term traders favor 10 or 20-day moving averages for quick signals. Long-term investors lean towards 50 or 200-day moving averages for trend confirmation. EMAs offer responsiveness to recent price changes.
Conclusion
You've grasped the essence of moving averages in technical analysis. By understanding the different types like SMA and EMA, you've unlocked the potential to predict market trends.
Apply these tools wisely to navigate the complex world of finance. Embrace the power of moving averages and watch as your trading strategies become sharper and more precise.
Stay ahead of the curve and let data guide your decisions for success in the ever-changing financial landscape.