
Exploring the intricacies of the Ultimate Oscillator unveils a realm of advanced insights that can significantly elevate one's analytical prowess in the realm of technical analysis.
From deciphering complex divergence patterns to harnessing the power of volume analysis, these advanced techniques provide a nuanced understanding of market dynamics that extends beyond conventional methods.
By optimizing timeframe selection and embracing a multi-timeframe approach, traders can gain a deeper insight into price movements and uncover hidden opportunities that may otherwise go unnoticed.
The Ultimate Oscillator serves as a gateway to a deeper understanding of market behavior, offering a wealth of advanced insights waiting to be unraveled.
Advanced Interpretation Techniques
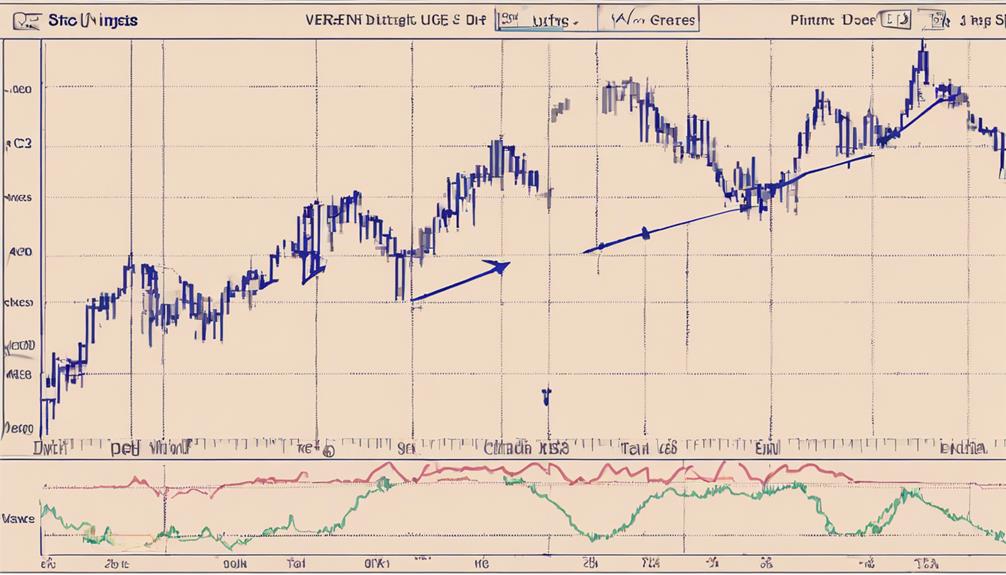
Advanced interpretation techniques for the Ultimate Oscillator delve deep into analyzing divergences with price action to strengthen trading signals. By closely examining these divergences, traders can gain valuable insights into potential trend reversals and the overall strength of the current market trend.
Understanding how the Ultimate Oscillator reacts to different market conditions is crucial for assessing trend strength accurately. Moreover, incorporating volume analysis alongside the Ultimate Oscillator can significantly enhance signal confirmation and improve the overall accuracy of trading decisions.
Advanced users often employ multiple timeframe analysis to validate signals across different time frames, offering a more comprehensive view of the market dynamics. Additionally, integrating trendline analysis with the Ultimate Oscillator can provide additional confirmation for potential trend reversals, adding further credibility to trading signals.
Leveraging Divergence Patterns
Utilizing divergence patterns in the Ultimate Oscillator provides valuable insights into potential trend reversals and enhances the accuracy of trading signals. Divergence patterns offer a deeper understanding of market dynamics and can help traders make more informed decisions.
Here are four key points to consider when leveraging divergence patterns with the Ultimate Oscillator:
- Bullish Divergence: This occurs when the price of an asset makes lower lows while the Ultimate Oscillator makes higher lows. It suggests a potential reversal in the downtrend and a possible upcoming price increase.
- Bearish Divergence: In contrast, bearish divergence happens when the price makes higher highs while the Ultimate Oscillator makes lower highs. This pattern indicates a potential reversal in the uptrend and a likely upcoming price decrease.
- Confirmation of Signals: Divergence patterns help confirm buy or sell signals generated by the Ultimate Oscillator, adding a layer of validation to trading decisions.
- Enhanced Trading Accuracy: Understanding and recognizing these divergence patterns can significantly enhance trading accuracy with the Ultimate Oscillator, providing traders with a competitive edge in the markets.
Incorporating Volume Analysis
When analyzing the Ultimate Oscillator, incorporating volume analysis provides traders with a comprehensive understanding of market dynamics by evaluating trading activity in conjunction with price movements. High volume during price increases indicates strong buying pressure and potential bullish signals, suggesting a greater likelihood of an upward trend continuation. Conversely, low volume during price declines suggests weak selling pressure and possible bearish signals, indicating a potential reversal or weakening of the current trend. By combining volume analysis with the Ultimate Oscillator, traders can confirm price trends and identify market strength more effectively.
Moreover, volume spikes play a crucial role in validating price movements indicated by the Ultimate Oscillator. These spikes can act as a confirmation tool, enhancing trading decisions by providing additional insight into the strength and sustainability of a particular price movement. Overall, incorporating volume analysis into Ultimate Oscillator analysis can help traders make more informed decisions and better navigate the complexities of the financial markets.
Optimizing Timeframe Selection
Timeframe selection plays a critical role in optimizing the accuracy and reliability of buy and sell signals generated by the Ultimate Oscillator. When choosing the timeframe, considering 7, 14, and 28 periods for calculation is essential.
Here are key points to consider in optimizing timeframe selection:
- Optimal Timeframe Choice: Selecting the right timeframe is crucial as it directly impacts signal accuracy.
- Longer Timeframes: Longer periods provide a broader view of price momentum trends, aiding in identifying major market movements.
- Shorter Timeframes: Shorter periods offer more timely signals, but they can also introduce more noise into the analysis, potentially leading to false signals.
- Market Conditions: Adapting timeframe selection based on current market conditions can enhance signal reliability by adjusting to the prevailing volatility and trend strength.
Implementing Multi-Timeframe Analysis
Implementing multi-timeframe analysis in Ultimate Oscillator enhances the depth of market insights by integrating short-term, intermediate, and long-term momentum perspectives. By considering 7, 14, and 28-period calculations, traders can gain a comprehensive view of price momentum.
The weighted averages utilized in Ultimate Oscillator provide a more accurate representation of momentum dynamics across different timeframes. This approach helps in reducing false signals that may arise from relying solely on one timeframe and aids in confirming the strength of identified trends.
Through the analysis of multiple timeframes, traders can make more informed decisions by assessing varying momentum perspectives. This method not only enhances the accuracy of signals but also allows for a more thorough understanding of market dynamics, leading to more effective trading strategies.
Ultimately, integrating multi-timeframe analysis into Ultimate Oscillator empowers traders to make well-informed decisions based on a holistic view of market momentum.
How Can I Apply Advanced Insights Into Ultimate Oscillator for Efficient Trading?
To achieve efficient application of oscillator in trading, it’s crucial to leverage advanced insights into the Ultimate Oscillator. By understanding the nuances of this tool and its signals, traders can make informed decisions and improve their overall trading efficiency. This can lead to more consistent and successful outcomes in the market.
Frequently Asked Questions
What Is the Ultimate Oscillator?
The Ultimate Oscillator, developed by Larry Williams in 1976, measures price momentum across short, intermediate, and long-term timeframes, ranging from 0 to 100. It aids in identifying overbought and oversold conditions, assisting traders in trend confirmation and decision-making.
What Is the Difference Between RSI and Ultimate Oscillator?
While RSI focuses on a single timeframe for momentum analysis, Ultimate Oscillator utilizes three timeframes, offering a more comprehensive view of price momentum. Ultimate Oscillator's weighted averages provide nuanced insights, contrasting RSI's direct overbought/oversold conditions identification.
Is Awesome Oscillator a Good Indicator?
The Awesome Oscillator, a momentum indicator by Bill Williams, aids in assessing market strength through 5-period and 34-period moving averages. Its color-coded histogram signals bullish or bearish momentum shifts, making it a valuable tool when combined with other indicators for trading decisions.
How Do You Calculate Ultimate Oscillator in Excel?
To calculate the Ultimate Oscillator in Excel, input High, Low, and Close prices. Compute True Range, Average True Range, Buying Pressure. Apply the weighted average formula to sum weighted BP and TR values for three periods.
Conclusion
In conclusion, the Ultimate Oscillator offers traders advanced insights into price momentum analysis across multiple timeframes.
By employing techniques such as divergence patterns, volume analysis, timeframe selection optimization, and multi-timeframe analysis, traders can enhance their decision-making process and improve the accuracy of their trading strategies.
The Ultimate Oscillator serves as a valuable tool for identifying market trends and potential entry/exit points, ultimately leading to more informed trading decisions.