
So, you've decided to dip your toes into the world of stock technical indicators – welcome to the realm where numbers, graphs, and patterns come to play.
But before you get overwhelmed by the sea of information out there, let's address the fundamental question: how can these indicators actually help you navigate the turbulent waters of the stock market?
Understanding the basics is just the first step; the real magic lies in deciphering how to apply this knowledge to your advantage.
Let's uncover the strategic insights waiting for you in this guide.
Types of Stock Technical Indicators
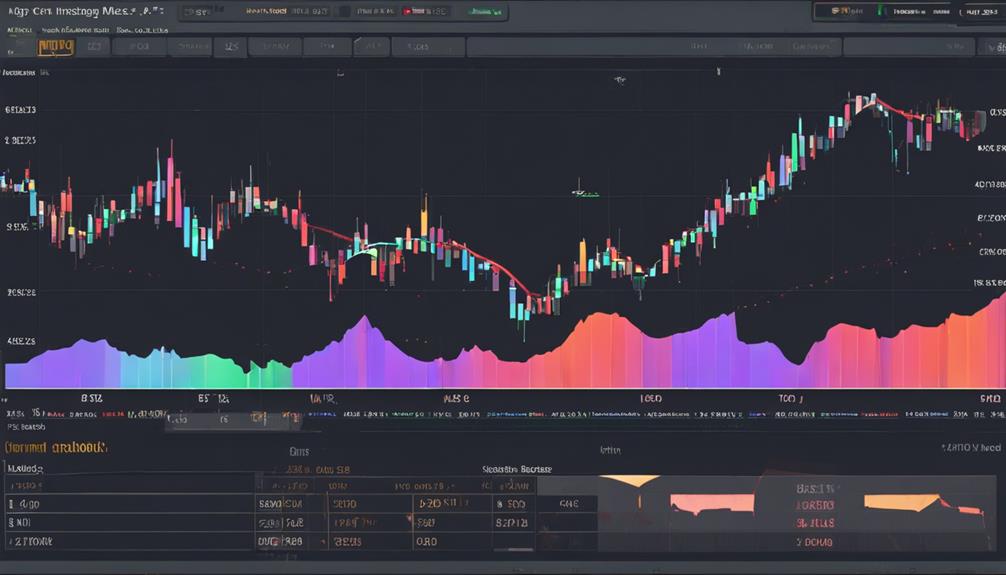
When delving into the realm of stock technical indicators, you'll encounter various types that serve distinct purposes in analyzing market trends and price movements. Moving averages are fundamental tools that help identify trends and potential support/resistance levels by smoothing out price data over a specific period.
The Relative Strength Index (RSI) is a momentum indicator that assesses whether a stock is overbought or oversold, indicating potential reversal points. Bollinger Bands, on the other hand, are volatility indicators that establish price range boundaries based on standard deviations from a moving average, offering insights into potential breakout or breakdown levels.
MACD, a trend-following momentum indicator, showcases the relationship between two moving averages, aiding in trend identification. Lastly, the Stochastic Oscillator gauges momentum and overbought/oversold conditions by comparing a stock's closing price to its price range over a set timeframe.
Common Technical Indicators Explained
Common technical indicators play a vital role in analyzing market trends and price movements, providing valuable insights for investors and traders alike. Moving averages smooth out price fluctuations, offering a clearer picture of the trend.
The Relative Strength Index (RSI) helps identify overbought or oversold conditions by measuring the speed of price movements. The Stochastic Oscillator compares a security's closing price to its price range to identify momentum shifts.
Moving Average Convergence Divergence (MACD) indicates trend direction by analyzing the relationship between two moving averages. Bollinger Bands, a volatility-based indicator, signal potential overbought or oversold conditions based on price movements.
Understanding these common technical indicators can assist in making informed decisions in trading and investing.
Applying Technical Indicators in Trading
To effectively utilize technical indicators in trading, understanding their individual characteristics and applications is essential for making informed investment decisions. Technical indicators like RSI, MACD, and Stochastic Oscillator help analyze price momentum and overbought/oversold conditions.
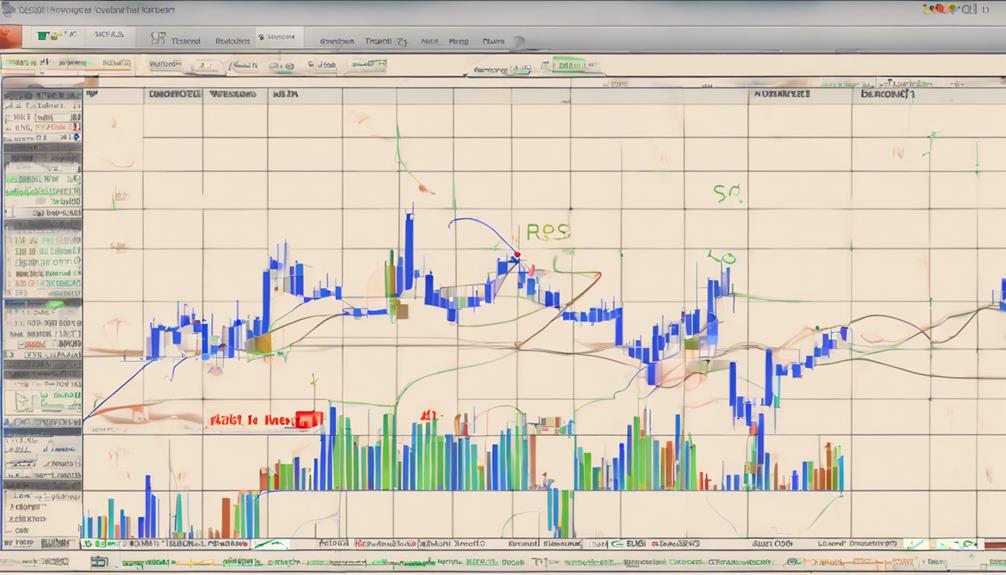
Moving averages, such as SMA and EMA, provide insight into trend direction and potential support/resistance levels. Bollinger Bands indicate trading ranges, aiding in identifying potential breakouts or reversals.
Recognizing key price levels like support and resistance is crucial for informed trading decisions using technical indicators. By examining the relationship between price action and technical indicators, traders enhance their decision-making process and improve trading strategies.
Incorporating these tools strategically can assist in navigating market fluctuations and seizing opportunities effectively.
Simplifying Technical Indicator Strategies

Understanding how to simplify technical indicator strategies can significantly enhance your trading efficiency and decision-making process. Utilizing indicators like Moving Average, Relative Strength Index (RSI), and MACD is common in technical analysis. Traders often look for signals where these indicators align with price action or chart patterns.
Some traders prefer Exponential Moving Average (EMA) over simple moving averages for faster responses to price changes. Identifying support levels and recognizing momentum indicators help in developing effective trading strategies. By simplifying the interpretation of these indicators and focusing on key aspects such as trend identification and potential reversals, you can streamline your trading approach and improve your overall performance.
Guidelines for Effective Indicator Usage

Enhance your trading efficiency and decision-making process by following these guidelines for effective indicator usage:
- Understand Each Indicator's Purpose: Different indicators like Moving Averages, RSI, and MACD serve specific functions in technical analysis.
- Seek Confirmation: Utilize multiple indicators such as Chart Patterns and Volume to validate trading signals.
- Align with Time Frames: Consider the timeframe of your analysis to match indicator signals with market movements effectively.
- Combine Indicators: Use a mix of indicators to get a comprehensive view of market trends, incorporating Exponential Moving Averages and Support levels.
Can Beginners Understand and Use Stock Technical Indicators Effectively?
For beginners, understanding stock technical indicators can be daunting. However, with the right beginners guide technical indicators, new investors can effectively learn how to interpret and use these tools to make informed decisions in the stock market. With practice and education, beginners can harness the power of technical indicators for successful trading.
Frequently Asked Questions
What Trading Indicator Is Good for a Beginner?
For a beginner, the Relative Strength Index (RSI) is a solid choice. It helps identify overbought or oversold conditions, confirms price trends, and finds potential reversal points. RSI, ranging from 0 to 100, enhances trading decisions.
How to Learn Technical Indicators?
To learn technical indicators, start by grasping their purpose in predicting price moves. Explore various types like overlay and independent indicators. Understand how they pinpoint support and resistance levels. Practice with common tools such as moving averages, RSI, and MACD for trading insights.
What Are the Top 5 Technical Analysis Indicators?
When diving into technical analysis, remember the top 5 indicators: MACD for trend changes, RSI for overbought/sold signals, Bollinger Bands to gauge volatility, Stochastic Oscillator for momentum, and Fibonacci Retracement for support/resistance levels.
What Is the Most Accurate Technical Indicator for Stocks?
When trading stocks, the Relative Strength Index (RSI) is a highly accurate technical indicator. It assesses price changes swiftly, aiding in identifying potential overbought or oversold conditions. Consider using RSI to enhance your trading strategies.
Conclusion
Now that you have a basic understanding of stock technical indicators, remember that 95% of all trading volumes in the stock market come from algorithmic trading strategies.
By utilizing technical indicators effectively, you can improve your trading decisions and increase your chances of success in the market.
Stay informed, stay disciplined, and continue learning to stay ahead of the game.
Happy trading!