
Embarking on the journey of understanding the MACD indicator is akin to unlocking a sophisticated compass in the world of trading. As you delve into its intricacies, you'll realize the power it holds in deciphering market trends and potential shifts.
The MACD's versatility goes beyond mere calculations; it equips you with a lens to gauge momentum and direction with precision. Delve into this guide to unravel how this indicator can elevate your trading acumen and unveil opportunities that might have remained unseen.
MACD Indicator Explained
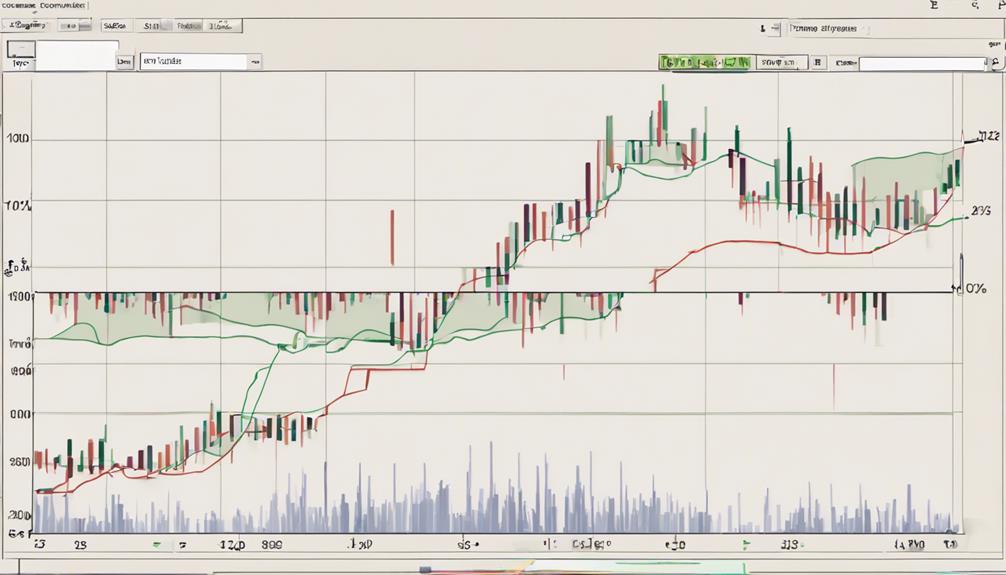
The MACD Indicator simplifies trend analysis by comparing two exponential moving averages to assess market momentum and direction. The MACD line, derived from the 12-day and 26-day EMAs, highlights the strength of a trend, while the 9-day EMA serves as the signal line, aiding in trend confirmation.
Divergence between the MACD line and the signal line often indicates potential trend reversals or shifts in momentum, providing traders with valuable insights. Additionally, the MACD histogram visually represents the difference between the MACD line and the signal line, offering a quick view of bullish or bearish momentum in the market.
Traders frequently utilize MACD crossovers, divergence, and histogram patterns to inform their trading decisions effectively.
MACD Formula and Calculation
Calculating the MACD indicator involves subtracting the 26-period EMA from the 12-period EMA. To understand the MACD Formula and Calculation better, remember these key points:
- MACD Line and Signal Line: The MACD line is created by taking the difference between the 12-period EMA and the 26-period EMA. The 9-day EMA of the MACD line is used as the signal line for buy or sell signals.
- MACD Histogram: This displays the variance between the MACD line and the signal line, indicating bullish or bearish momentum.
- EMA Comparison: Positive MACD values arise when the 12-period EMA is higher than the 26-period EMA, while negative values occur when the 12-period EMA is lower. Understanding these calculations can assist in recognizing MACD crosses and potential bullish/bearish signals.
Interpreting MACD Crossovers
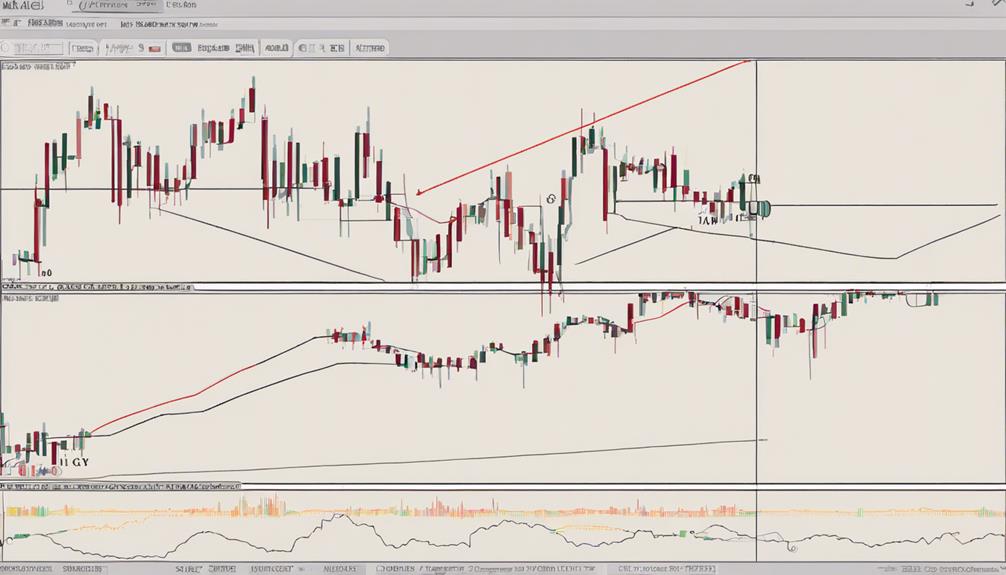
When interpreting MACD crossovers, focus on identifying key signals for potential market entry or exit points. A bullish crossover, where the MACD line surpasses the signal line, suggests a favorable moment to consider buying.
Conversely, a bearish crossover occurs when the MACD line falls below the signal line, indicating a potential selling opportunity. Traders utilize MACD crossovers to confirm trend changes and make informed entry or exit decisions.
Additionally, centerline crossovers, where the MACD line crosses the zero line, signify shifts in market momentum and trend direction. By interpreting these crossovers, traders can gain insights into the current market conditions and make strategic decisions to align with the prevailing trends.
Trading Strategies With MACD
Explore various trading strategies utilizing the MACD indicator to optimize your decision-making process and enhance trading outcomes.
When incorporating MACD into your trading approach, consider the following:
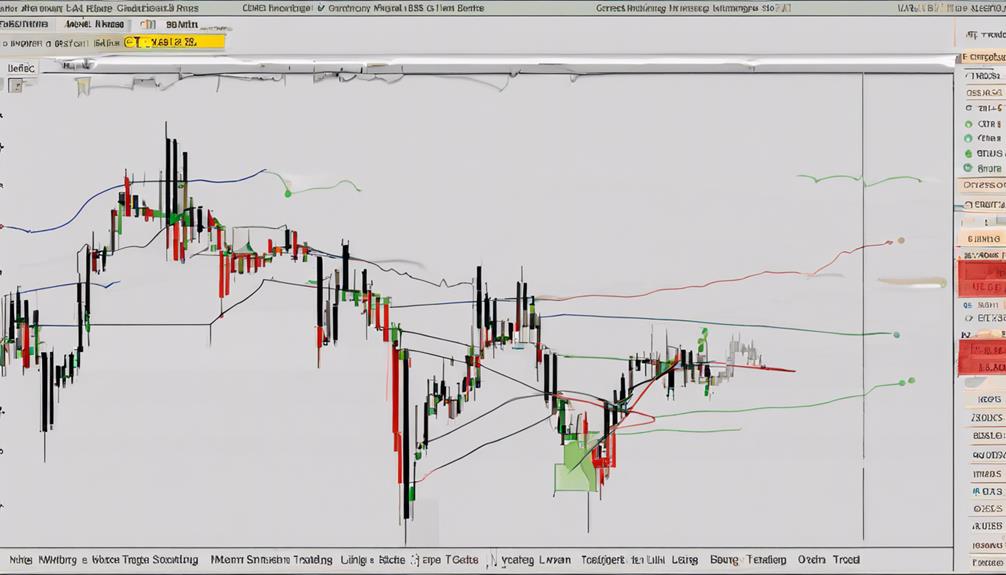
- MACD Crossovers: Utilize the crossover between the MACD line and the signal line as potential entry or exit points.
- MACD Divergence: Watch for instances where the price trend deviates from the MACD indicator trend, signaling possible reversals.
- Moving Average Convergence Divergence (MACD) Histogram: Monitor the histogram to identify momentum shifts in the price trend.
Limitations and Common Mistakes

To navigate the limitations and common mistakes associated with the MACD indicator, traders must exercise caution and seek supplementary confirmation from trend-following indicators like ADX. MACD can generate false positive signals, potentially leading to misguided trading decisions.
Divergence within MACD doesn't always accurately predict real price reversals, emphasizing the need for additional confirmation. It's crucial to double-check MACD signals with trend-following indicators such as ADX before executing trades.
Common mistakes to avoid include misinterpreting MACD crossovers and utilizing MACD in range-bound markets where its effectiveness may be limited. By being mindful of these limitations and common pitfalls, traders can enhance their decision-making process and improve the accuracy of their trading strategies.
How Can I Use the MACD Indicator in Forex Trading?
When you interpret MACD indicator Forex trading, pay attention to the crossover between the MACD line and the signal line to identify potential entry and exit points. Additionally, look for divergences between the MACD and price action to anticipate potential trend reversals. Mastering this indicator takes time and practice.
Frequently Asked Questions
How Do You Read MACD for Dummies?
To read MACD for dummies, focus on crossovers between the MACD line and signal line for buy or sell signals. Recognize bullish or bearish trends through histogram patterns. Utilize MACD divergence to spot potential reversals.
How Do You Use MACD Indicator Effectively?
When using MACD effectively, start by analyzing crossovers, divergences, and histogram patterns for optimal buy and sell signals. Incorporate MACD into your trading strategy to predict momentum shifts and market trends, enhancing decision-making and trading outcomes.
What Is the MACD Indicator Simplified?
To simplify, MACD is a tool that tracks moving averages to reveal trends in stock prices. It uses the difference between a security's 12-day and 26-day moving averages, aiding traders in spotting potential buy and sell signals.
What Are the 3 Components of MACD Indicator?
To grasp the MACD indicator, focus on its trio: MACD line, signal line, and MACD histogram. These components intertwine to reveal market trends, momentum shifts, and ideal entry or exit points for traders.
Conclusion
You've now mastered the MACD indicator, unlocking the key to deciphering market trends and potential trading opportunities. With this powerful tool in your arsenal, you're equipped to navigate the complex world of trading with confidence and precision.
So go forth, fearless trader, and conquer the markets with the wisdom of the MACD at your fingertips. The possibilities are endless, and success is within reach!